
Advertisement
- United States
- /
- Healthcare Services
- /
- NYSE:CNC
Here's What Centene Corporation's (NYSE:CNC) P/E Is Telling Us

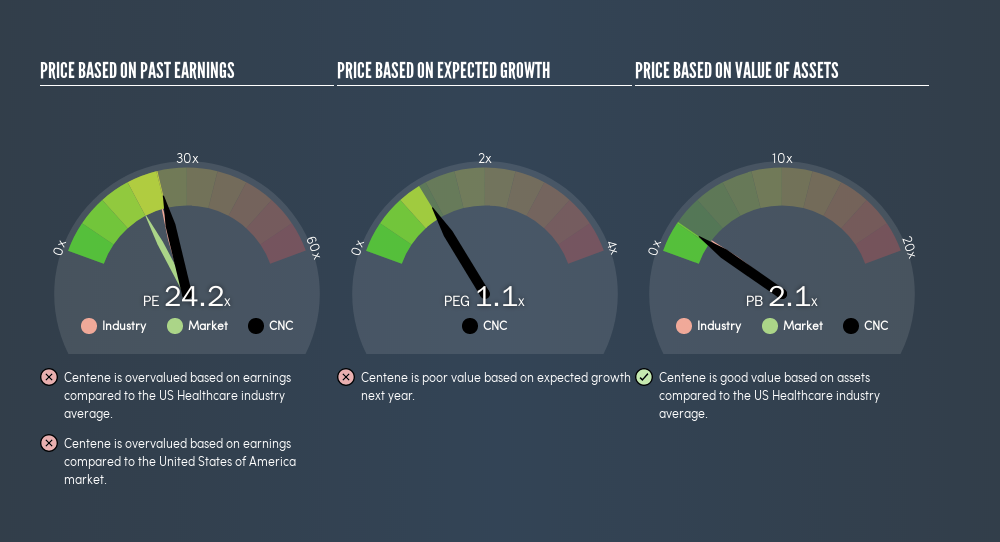
This article is written for those who want to get better at using price to earnings ratios (P/E ratios). To keep it practical, we'll show how Centene Corporation's (NYSE:CNC) P/E ratio could help you assess the value on offer. What is Centene's P/E ratio? Well, based on the last twelve months it is 24.21. In other words, at today's prices, investors are paying $24.21 for every $1 in prior year profit.
Check out our latest analysis for Centene
How Do You Calculate Centene's P/E Ratio?
The formula for P/E is:
Price to Earnings Ratio = Price per Share ÷ Earnings per Share (EPS)
Or for Centene:
P/E of 24.21 = $55.84 ÷ $2.31 (Based on the year to December 2018.)
Is A High Price-to-Earnings Ratio Good?
A higher P/E ratio means that investors are paying a higher price for each $1 of company earnings. That is not a good or a bad thing per se, but a high P/E does imply buyers are optimistic about the future.
How Growth Rates Impact P/E Ratios
Probably the most important factor in determining what P/E a company trades on is the earnings growth. That's because companies that grow earnings per share quickly will rapidly increase the 'E' in the equation. Therefore, even if you pay a high multiple of earnings now, that multiple will become lower in the future. So while a stock may look expensive based on past earnings, it could be cheap based on future earnings.
Centene's earnings per share fell by 3.9% in the last twelve months. But it has grown its earnings per share by 25% per year over the last five years.
Does Centene Have A Relatively High Or Low P/E For Its Industry?
We can get an indication of market expectations by looking at the P/E ratio. As you can see below Centene has a P/E ratio that is fairly close for the average for the healthcare industry, which is 23.
Centene's P/E tells us that market participants think its prospects are roughly in line with its industry. So if Centene actually outperforms its peers going forward, that should be a positive for the share price. I inform my view byby checking management tenure and remuneration, among other things.
A Limitation: P/E Ratios Ignore Debt and Cash In The Bank
The 'Price' in P/E reflects the market capitalization of the company. Thus, the metric does not reflect cash or debt held by the company. Theoretically, a business can improve its earnings (and produce a lower P/E in the future) by investing in growth. That means taking on debt (or spending its cash).
Such spending might be good or bad, overall, but the key point here is that you need to look at debt to understand the P/E ratio in context.
How Does Centene's Debt Impact Its P/E Ratio?
Net debt totals just 3.1% of Centene's market cap. It would probably trade on a higher P/E ratio if it had a lot of cash, but I doubt it is having a big impact.
The Verdict On Centene's P/E Ratio
Centene has a P/E of 24.2. That's higher than the average in the US market, which is 18.1. With some debt but no EPS growth last year, the market has high expectations of future profits.
Investors should be looking to buy stocks that the market is wrong about. As value investor Benjamin Graham famously said, 'In the short run, the market is a voting machine but in the long run, it is a weighing machine.' So this freevisualization of the analyst consensus on future earnings could help you make the right decision about whether to buy, sell, or hold.
But note: Centene may not be the best stock to buy. So take a peek at this freelist of interesting companies with strong recent earnings growth (and a P/E ratio below 20).
We aim to bring you long-term focused research analysis driven by fundamental data. Note that our analysis may not factor in the latest price-sensitive company announcements or qualitative material.
If you spot an error that warrants correction, please contact the editor at editorial-team@simplywallst.com. This article by Simply Wall St is general in nature. It does not constitute a recommendation to buy or sell any stock, and does not take account of your objectives, or your financial situation. Simply Wall St has no position in the stocks mentioned. Thank you for reading.
About NYSE:CNC
Centene
Operates as a healthcare enterprise that provides programs and services to under-insured and uninsured families, and commercial organizations in the United States.
Very undervalued with solid track record.
Similar Companies
Market Insights

Advertisement
Community Narratives
Vita Life Sciences Set for a 12.72% Revenue Growth While Tackling Operational Challenges
Fair Value AU$2.42|9.5% undervalued
RO
Community Contributor
Vossloh rides a €500 billion wave to boost growth and earnings in the next decade
Fair Value €78.41|6.1% undervalued
CH
Community Contributor
Intuitive Surgical Will Transform Healthcare with 12% Revenue Growth
Fair Value US$325.55|56.5% overvalued
UN
Community Contributor