- United States
- /
- Healthcare Services
- /
- NYSE:CAH
Cardinal Health, Inc. (NYSE:CAH) Shares Could Be 45% Below Their Intrinsic Value Estimate


Key Insights
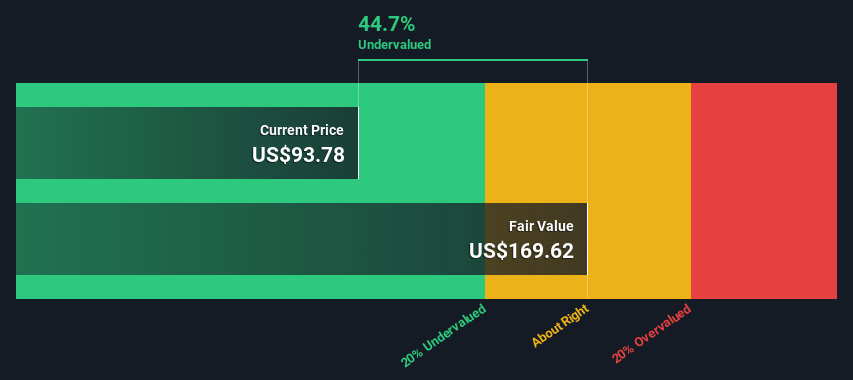
- The projected fair value for Cardinal Health is US$170 based on 2 Stage Free Cash Flow to Equity
- Cardinal Health's US$93.78 share price signals that it might be 45% undervalued
- The US$95.59 analyst price target for CAH is 44% less than our estimate of fair value
Today we'll do a simple run through of a valuation method used to estimate the attractiveness of Cardinal Health, Inc. (NYSE:CAH) as an investment opportunity by taking the forecast future cash flows of the company and discounting them back to today's value. The Discounted Cash Flow (DCF) model is the tool we will apply to do this. Believe it or not, it's not too difficult to follow, as you'll see from our example!
Remember though, that there are many ways to estimate a company's value, and a DCF is just one method. If you still have some burning questions about this type of valuation, take a look at the Simply Wall St analysis model.
View our latest analysis for Cardinal Health
Is Cardinal Health Fairly Valued?
We are going to use a two-stage DCF model, which, as the name states, takes into account two stages of growth. The first stage is generally a higher growth period which levels off heading towards the terminal value, captured in the second 'steady growth' period. To start off with, we need to estimate the next ten years of cash flows. Where possible we use analyst estimates, but when these aren't available we extrapolate the previous free cash flow (FCF) from the last estimate or reported value. We assume companies with shrinking free cash flow will slow their rate of shrinkage, and that companies with growing free cash flow will see their growth rate slow, over this period. We do this to reflect that growth tends to slow more in the early years than it does in later years.
Generally we assume that a dollar today is more valuable than a dollar in the future, and so the sum of these future cash flows is then discounted to today's value:
10-year free cash flow (FCF) estimate
| 2024 | 2025 | 2026 | 2027 | 2028 | 2029 | 2030 | 2031 | 2032 | 2033 | |
| Levered FCF ($, Millions) | US$1.92b | US$1.98b | US$1.94b | US$1.59b | US$1.95b | US$1.93b | US$1.92b | US$1.94b | US$1.96b | US$1.98b |
| Growth Rate Estimate Source | Analyst x5 | Analyst x6 | Analyst x5 | Analyst x2 | Analyst x1 | Est @ -1.03% | Est @ -0.07% | Est @ 0.59% | Est @ 1.06% | Est @ 1.39% |
| Present Value ($, Millions) Discounted @ 6.2% | US$1.8k | US$1.8k | US$1.6k | US$1.2k | US$1.4k | US$1.3k | US$1.3k | US$1.2k | US$1.1k | US$1.1k |
("Est" = FCF growth rate estimated by Simply Wall St)
Present Value of 10-year Cash Flow (PVCF) = US$14b
After calculating the present value of future cash flows in the initial 10-year period, we need to calculate the Terminal Value, which accounts for all future cash flows beyond the first stage. For a number of reasons a very conservative growth rate is used that cannot exceed that of a country's GDP growth. In this case we have used the 5-year average of the 10-year government bond yield (2.2%) to estimate future growth. In the same way as with the 10-year 'growth' period, we discount future cash flows to today's value, using a cost of equity of 6.2%.
Terminal Value (TV)= FCF2033 × (1 + g) ÷ (r – g) = US$2.0b× (1 + 2.2%) ÷ (6.2%– 2.2%) = US$51b
Present Value of Terminal Value (PVTV)= TV / (1 + r)10= US$51b÷ ( 1 + 6.2%)10= US$28b
The total value is the sum of cash flows for the next ten years plus the discounted terminal value, which results in the Total Equity Value, which in this case is US$42b. To get the intrinsic value per share, we divide this by the total number of shares outstanding. Compared to the current share price of US$93.8, the company appears quite undervalued at a 45% discount to where the stock price trades currently. Remember though, that this is just an approximate valuation, and like any complex formula - garbage in, garbage out.
Important Assumptions
The calculation above is very dependent on two assumptions. The first is the discount rate and the other is the cash flows. If you don't agree with these result, have a go at the calculation yourself and play with the assumptions. The DCF also does not consider the possible cyclicality of an industry, or a company's future capital requirements, so it does not give a full picture of a company's potential performance. Given that we are looking at Cardinal Health as potential shareholders, the cost of equity is used as the discount rate, rather than the cost of capital (or weighted average cost of capital, WACC) which accounts for debt. In this calculation we've used 6.2%, which is based on a levered beta of 0.801. Beta is a measure of a stock's volatility, compared to the market as a whole. We get our beta from the industry average beta of globally comparable companies, with an imposed limit between 0.8 and 2.0, which is a reasonable range for a stable business.
SWOT Analysis for Cardinal Health
- Debt is well covered by earnings and cashflows.
- Dividend is low compared to the top 25% of dividend payers in the Healthcare market.
- Annual earnings are forecast to grow faster than the American market.
- Trading below our estimate of fair value by more than 20%.
- Total liabilities exceed total assets, which raises the risk of financial distress.
- Dividends are not covered by earnings.
- Annual revenue is forecast to grow slower than the American market.
Next Steps:
Whilst important, the DCF calculation ideally won't be the sole piece of analysis you scrutinize for a company. DCF models are not the be-all and end-all of investment valuation. Instead the best use for a DCF model is to test certain assumptions and theories to see if they would lead to the company being undervalued or overvalued. For instance, if the terminal value growth rate is adjusted slightly, it can dramatically alter the overall result. Can we work out why the company is trading at a discount to intrinsic value? For Cardinal Health, there are three important items you should further examine:
- Risks: As an example, we've found 5 warning signs for Cardinal Health that you need to consider before investing here.
- Management:Have insiders been ramping up their shares to take advantage of the market's sentiment for CAH's future outlook? Check out our management and board analysis with insights on CEO compensation and governance factors.
- Other High Quality Alternatives: Do you like a good all-rounder? Explore our interactive list of high quality stocks to get an idea of what else is out there you may be missing!
PS. Simply Wall St updates its DCF calculation for every American stock every day, so if you want to find the intrinsic value of any other stock just search here.
New: AI Stock Screener & Alerts
Our new AI Stock Screener scans the market every day to uncover opportunities.
• Dividend Powerhouses (3%+ Yield)
• Undervalued Small Caps with Insider Buying
• High growth Tech and AI Companies
Or build your own from over 50 metrics.
Have feedback on this article? Concerned about the content? Get in touch with us directly. Alternatively, email editorial-team (at) simplywallst.com.
This article by Simply Wall St is general in nature. We provide commentary based on historical data and analyst forecasts only using an unbiased methodology and our articles are not intended to be financial advice. It does not constitute a recommendation to buy or sell any stock, and does not take account of your objectives, or your financial situation. We aim to bring you long-term focused analysis driven by fundamental data. Note that our analysis may not factor in the latest price-sensitive company announcements or qualitative material. Simply Wall St has no position in any stocks mentioned.
About NYSE:CAH
Cardinal Health
Operates as a healthcare services and products company in the United States, Canada, Europe, Asia, and internationally.
Undervalued with solid track record and pays a dividend.

