
Advertisement
Legendary fund manager Li Lu (who Charlie Munger backed) once said, 'The biggest investment risk is not the volatility of prices, but whether you will suffer a permanent loss of capital.' It's only natural to consider a company's balance sheet when you examine how risky it is, since debt is often involved when a business collapses. Importantly, SI-BONE, Inc. (NASDAQ:SIBN) does carry debt. But the more important question is: how much risk is that debt creating?
Why Does Debt Bring Risk?
Debt assists a business until the business has trouble paying it off, either with new capital or with free cash flow. Part and parcel of capitalism is the process of 'creative destruction' where failed businesses are mercilessly liquidated by their bankers. However, a more usual (but still expensive) situation is where a company must dilute shareholders at a cheap share price simply to get debt under control. Of course, the upside of debt is that it often represents cheap capital, especially when it replaces dilution in a company with the ability to reinvest at high rates of return. The first thing to do when considering how much debt a business uses is to look at its cash and debt together.
What Is SI-BONE's Debt?
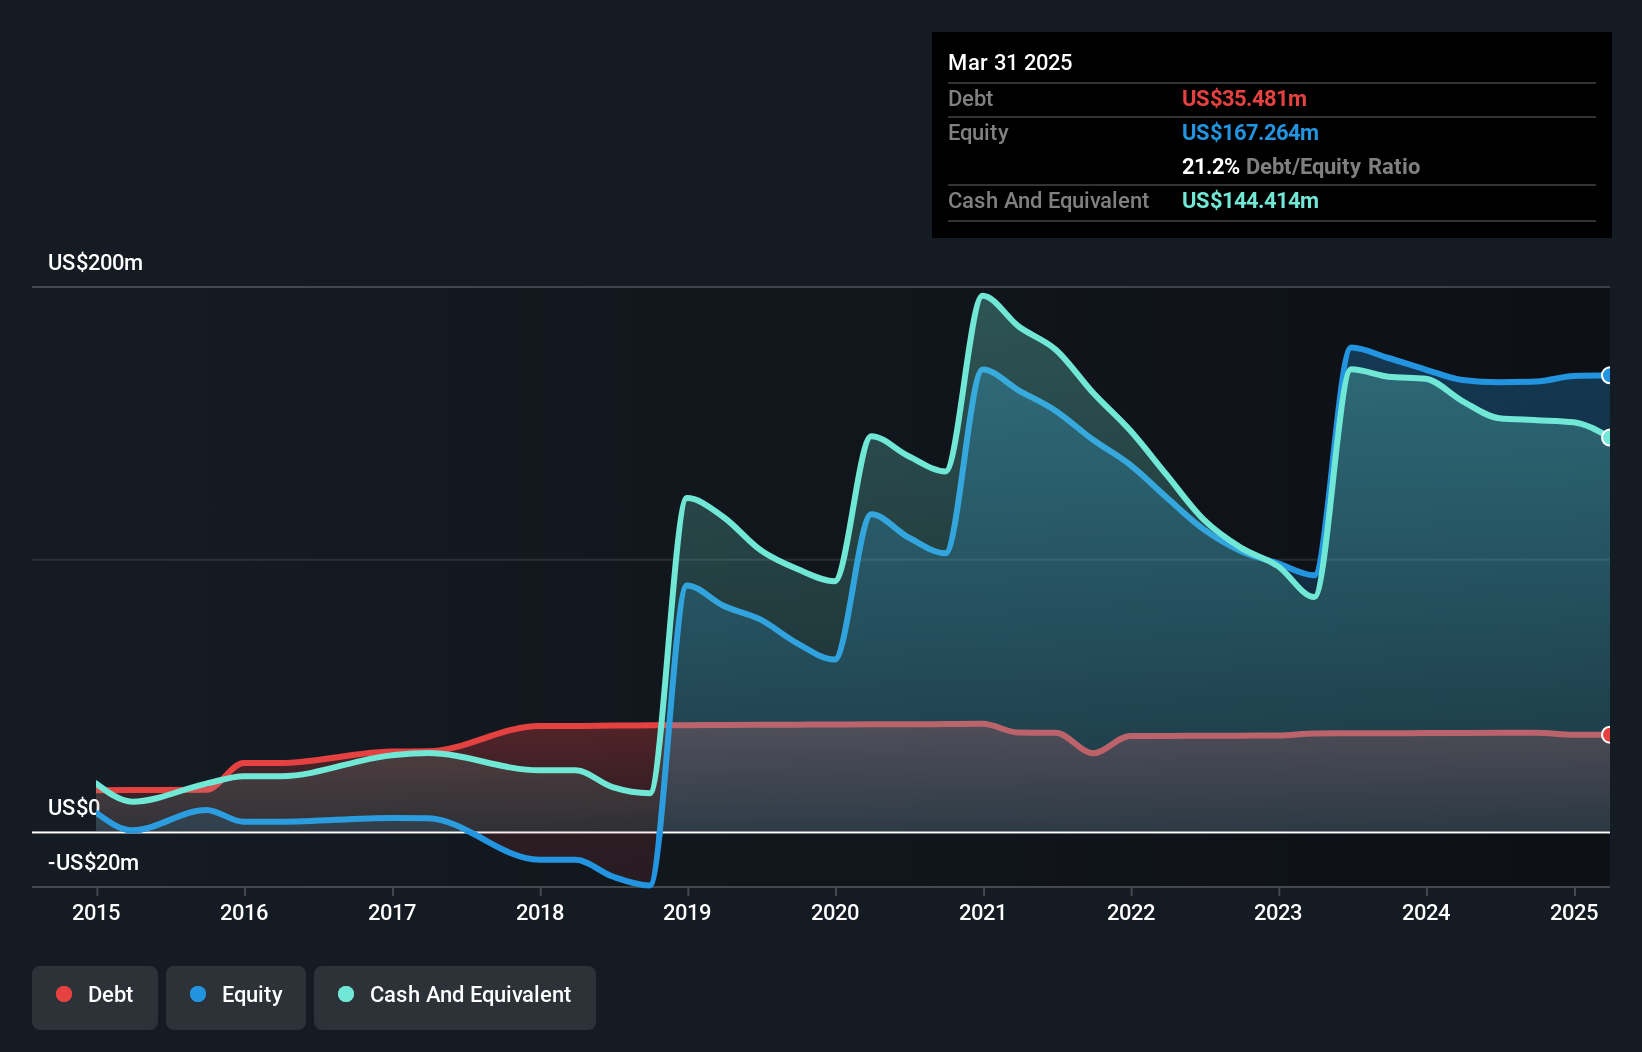
The chart below, which you can click on for greater detail, shows that SI-BONE had US$35.5m in debt in March 2025; about the same as the year before. But on the other hand it also has US$144.4m in cash, leading to a US$108.9m net cash position.
How Strong Is SI-BONE's Balance Sheet?
According to the last reported balance sheet, SI-BONE had liabilities of US$24.0m due within 12 months, and liabilities of US$36.1m due beyond 12 months. Offsetting these obligations, it had cash of US$144.4m as well as receivables valued at US$27.1m due within 12 months. So it can boast US$111.5m more liquid assets than total liabilities.
This surplus suggests that SI-BONE has a conservative balance sheet, and could probably eliminate its debt without much difficulty. Succinctly put, SI-BONE boasts net cash, so it's fair to say it does not have a heavy debt load! When analysing debt levels, the balance sheet is the obvious place to start. But ultimately the future profitability of the business will decide if SI-BONE can strengthen its balance sheet over time. So if you're focused on the future you can check out this free report showing analyst profit forecasts.
Check out our latest analysis for SI-BONE
Over 12 months, SI-BONE reported revenue of US$177m, which is a gain of 23%, although it did not report any earnings before interest and tax. Shareholders probably have their fingers crossed that it can grow its way to profits.
So How Risky Is SI-BONE?
We have no doubt that loss making companies are, in general, riskier than profitable ones. And we do note that SI-BONE had an earnings before interest and tax (EBIT) loss, over the last year. Indeed, in that time it burnt through US$20m of cash and made a loss of US$27m. But the saving grace is the US$108.9m on the balance sheet. That means it could keep spending at its current rate for more than two years. SI-BONE's revenue growth shone bright over the last year, so it may well be in a position to turn a profit in due course. By investing before those profits, shareholders take on more risk in the hope of bigger rewards. There's no doubt that we learn most about debt from the balance sheet. However, not all investment risk resides within the balance sheet - far from it. For instance, we've identified 2 warning signs for SI-BONE that you should be aware of.
When all is said and done, sometimes its easier to focus on companies that don't even need debt. Readers can access a list of growth stocks with zero net debt 100% free, right now.
New: Manage All Your Stock Portfolios in One Place
We've created the ultimate portfolio companion for stock investors, and it's free.
• Connect an unlimited number of Portfolios and see your total in one currency
• Be alerted to new Warning Signs or Risks via email or mobile
• Track the Fair Value of your stocks
Have feedback on this article? Concerned about the content? Get in touch with us directly. Alternatively, email editorial-team (at) simplywallst.com.
This article by Simply Wall St is general in nature. We provide commentary based on historical data and analyst forecasts only using an unbiased methodology and our articles are not intended to be financial advice. It does not constitute a recommendation to buy or sell any stock, and does not take account of your objectives, or your financial situation. We aim to bring you long-term focused analysis driven by fundamental data. Note that our analysis may not factor in the latest price-sensitive company announcements or qualitative material. Simply Wall St has no position in any stocks mentioned.
About NasdaqGM:SIBN
SI-BONE
A medical device company, focuses on solving musculoskeletal disorders of the sacropelvic anatomy in the United States and internationally.
Flawless balance sheet and fair value.
Similar Companies
Market Insights

Advertisement
Community Narratives
The company that turned a verb into a global necessity and basically runs the modern internet, digital ads, smartphones, maps, and AI.
Fair Value US$300.00|6.2% undervalued
OS
Community Contributor
Flowers Foods Pays A Fair Price For Health
Fair Value US$16.12|25.1% undervalued
NV
Community Contributor
TMX Group will thrive with 33.3% profit margin and enduring market moat
Fair Value CA$49.90|0.04% overvalued
LI
Community Contributor