
Advertisement
- United States
- /
- Healthcare Services
- /
- NasdaqGM:NNOX
Is Nano-X Imaging (NASDAQ:NNOX) Weighed On By Its Debt Load?
Some say volatility, rather than debt, is the best way to think about risk as an investor, but Warren Buffett famously said that 'Volatility is far from synonymous with risk.' So it seems the smart money knows that debt - which is usually involved in bankruptcies - is a very important factor, when you assess how risky a company is. We note that Nano-X Imaging Ltd. (NASDAQ:NNOX) does have debt on its balance sheet. But the real question is whether this debt is making the company risky.
What Risk Does Debt Bring?
Debt assists a business until the business has trouble paying it off, either with new capital or with free cash flow. If things get really bad, the lenders can take control of the business. While that is not too common, we often do see indebted companies permanently diluting shareholders because lenders force them to raise capital at a distressed price. Of course, plenty of companies use debt to fund growth, without any negative consequences. The first step when considering a company's debt levels is to consider its cash and debt together.
View our latest analysis for Nano-X Imaging
How Much Debt Does Nano-X Imaging Carry?
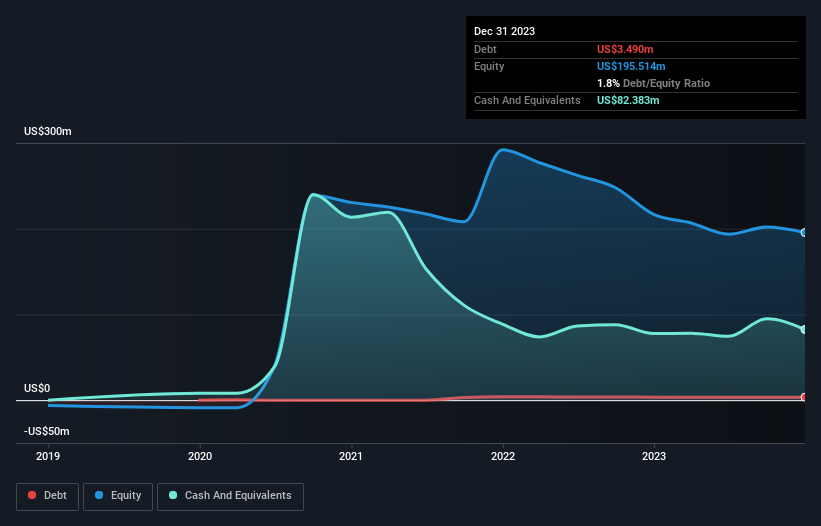
As you can see below, Nano-X Imaging had US$3.49m of debt, at December 2023, which is about the same as the year before. You can click the chart for greater detail. But it also has US$82.4m in cash to offset that, meaning it has US$78.9m net cash.
How Strong Is Nano-X Imaging's Balance Sheet?
The latest balance sheet data shows that Nano-X Imaging had liabilities of US$15.5m due within a year, and liabilities of US$7.61m falling due after that. Offsetting this, it had US$82.4m in cash and US$1.48m in receivables that were due within 12 months. So it actually has US$60.7m more liquid assets than total liabilities.
This surplus suggests that Nano-X Imaging has a conservative balance sheet, and could probably eliminate its debt without much difficulty. Succinctly put, Nano-X Imaging boasts net cash, so it's fair to say it does not have a heavy debt load! When analysing debt levels, the balance sheet is the obvious place to start. But ultimately the future profitability of the business will decide if Nano-X Imaging can strengthen its balance sheet over time. So if you want to see what the professionals think, you might find this free report on analyst profit forecasts to be interesting.
Over 12 months, Nano-X Imaging reported revenue of US$9.9m, which is a gain of 15%, although it did not report any earnings before interest and tax. That rate of growth is a bit slow for our taste, but it takes all types to make a world.
So How Risky Is Nano-X Imaging?
We have no doubt that loss making companies are, in general, riskier than profitable ones. And the fact is that over the last twelve months Nano-X Imaging lost money at the earnings before interest and tax (EBIT) line. Indeed, in that time it burnt through US$48m of cash and made a loss of US$61m. But at least it has US$78.9m on the balance sheet to spend on growth, near-term. Even though its balance sheet seems sufficiently liquid, debt always makes us a little nervous if a company doesn't produce free cash flow regularly. When analysing debt levels, the balance sheet is the obvious place to start. But ultimately, every company can contain risks that exist outside of the balance sheet. Be aware that Nano-X Imaging is showing 2 warning signs in our investment analysis , and 1 of those is significant...
Of course, if you're the type of investor who prefers buying stocks without the burden of debt, then don't hesitate to discover our exclusive list of net cash growth stocks, today.
Valuation is complex, but we're here to simplify it.
Discover if Nano-X Imaging might be undervalued or overvalued with our detailed analysis, featuring fair value estimates, potential risks, dividends, insider trades, and its financial condition.
Access Free AnalysisHave feedback on this article? Concerned about the content? Get in touch with us directly. Alternatively, email editorial-team (at) simplywallst.com.
This article by Simply Wall St is general in nature. We provide commentary based on historical data and analyst forecasts only using an unbiased methodology and our articles are not intended to be financial advice. It does not constitute a recommendation to buy or sell any stock, and does not take account of your objectives, or your financial situation. We aim to bring you long-term focused analysis driven by fundamental data. Note that our analysis may not factor in the latest price-sensitive company announcements or qualitative material. Simply Wall St has no position in any stocks mentioned.
About NasdaqGM:NNOX
Nano-X Imaging
Develops a commercial-grade tomographic imaging device with a digital X-ray source.
Excellent balance sheet with limited growth.
Market Insights

Advertisement
Community Narratives
MicroVision will explode future revenue by 380.37% with a vision towards success
Fair Value US$60.00|98.5% undervalued
TH
Community Contributor
The Indispensable Artery for a New North American Economy
Fair Value CA$132.87|2.3% undervalued
TI
Community Contributor