
Advertisement
- United States
- /
- Food
- /
- NYSEAM:SEB
Seaboard Corporation (NYSEMKT:SEB) Stock Is Going Strong But Fundamentals Look Uncertain: What Lies Ahead ?
Seaboard's (NYSEMKT:SEB) stock is up by a considerable 17% over the past three months. However, we decided to pay attention to the company's fundamentals which don't appear to give a clear sign about the company's financial health. In this article, we decided to focus on Seaboard's ROE.
ROE or return on equity is a useful tool to assess how effectively a company can generate returns on the investment it received from its shareholders. In simpler terms, it measures the profitability of a company in relation to shareholder's equity.
Check out our latest analysis for Seaboard
How To Calculate Return On Equity?
Return on equity can be calculated by using the formula:
Return on Equity = Net Profit (from continuing operations) ÷ Shareholders' Equity
So, based on the above formula, the ROE for Seaboard is:
7.4% = US$283m ÷ US$3.8b (Based on the trailing twelve months to December 2020).
The 'return' is the amount earned after tax over the last twelve months. One way to conceptualize this is that for each $1 of shareholders' capital it has, the company made $0.07 in profit.
What Has ROE Got To Do With Earnings Growth?
So far, we've learned that ROE is a measure of a company's profitability. We now need to evaluate how much profit the company reinvests or "retains" for future growth which then gives us an idea about the growth potential of the company. Generally speaking, other things being equal, firms with a high return on equity and profit retention, have a higher growth rate than firms that don’t share these attributes.
Seaboard's Earnings Growth And 7.4% ROE
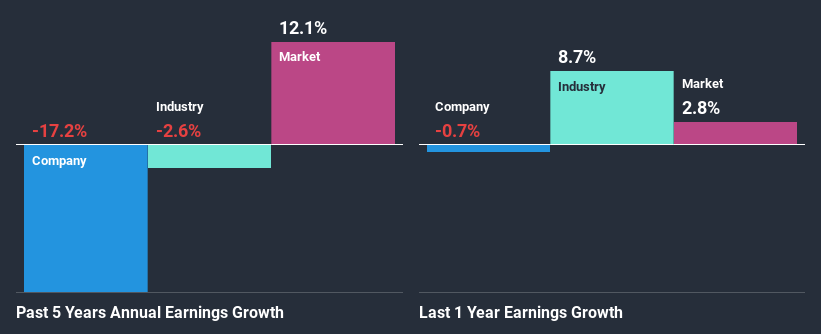
On the face of it, Seaboard's ROE is not much to talk about. Next, when compared to the average industry ROE of 10%, the company's ROE leaves us feeling even less enthusiastic. Therefore, it might not be wrong to say that the five year net income decline of 17% seen by Seaboard was probably the result of it having a lower ROE. We reckon that there could also be other factors at play here. Such as - low earnings retention or poor allocation of capital.
Next, when we compared with the industry, which has shrunk its earnings at a rate of 2.6% in the same period, we still found Seaboard's performance to be quite bleak, because the company has been shrinking its earnings faster than the industry.
The basis for attaching value to a company is, to a great extent, tied to its earnings growth. It’s important for an investor to know whether the market has priced in the company's expected earnings growth (or decline). Doing so will help them establish if the stock's future looks promising or ominous. One good indicator of expected earnings growth is the P/E ratio which determines the price the market is willing to pay for a stock based on its earnings prospects. So, you may want to check if Seaboard is trading on a high P/E or a low P/E, relative to its industry.
Is Seaboard Efficiently Re-investing Its Profits?
Seaboard's low three-year median payout ratio of 7.2% (implying that it retains the remaining 93% of its profits) comes as a surprise when you pair it with the shrinking earnings. This typically shouldn't be the case when a company is retaining most of its earnings. It looks like there might be some other reasons to explain the lack in that respect. For example, the business could be in decline.
Additionally, Seaboard has paid dividends over a period of at least ten years, which means that the company's management is determined to pay dividends even if it means little to no earnings growth.
Conclusion
On the whole, we feel that the performance shown by Seaboard can be open to many interpretations. While the company does have a high rate of profit retention, its low rate of return is probably hampering its earnings growth. Wrapping up, we would proceed with caution with this company and one way of doing that would be to look at the risk profile of the business. You can see the 1 risk we have identified for Seaboard by visiting our risks dashboard for free on our platform here.
If you decide to trade Seaboard, use the lowest-cost* platform that is rated #1 Overall by Barron’s, Interactive Brokers. Trade stocks, options, futures, forex, bonds and funds on 135 markets, all from a single integrated account. Promoted
New: Manage All Your Stock Portfolios in One Place
We've created the ultimate portfolio companion for stock investors, and it's free.
• Connect an unlimited number of Portfolios and see your total in one currency
• Be alerted to new Warning Signs or Risks via email or mobile
• Track the Fair Value of your stocks
This article by Simply Wall St is general in nature. It does not constitute a recommendation to buy or sell any stock, and does not take account of your objectives, or your financial situation. We aim to bring you long-term focused analysis driven by fundamental data. Note that our analysis may not factor in the latest price-sensitive company announcements or qualitative material. Simply Wall St has no position in any stocks mentioned.
*Interactive Brokers Rated Lowest Cost Broker by StockBrokers.com Annual Online Review 2020
Have feedback on this article? Concerned about the content? Get in touch with us directly. Alternatively, email editorial-team (at) simplywallst.com.
About NYSEAM:SEB
Seaboard
Operates in agricultural, energy, and ocean transportation business worldwide.
Excellent balance sheet with proven track record.
Similar Companies
Market Insights

Advertisement
Community Narratives
The company that turned a verb into a global necessity and basically runs the modern internet, digital ads, smartphones, maps, and AI.
Fair Value US$300.00|5.2% undervalued
OS
Community Contributor
Flowers Foods Pays A Fair Price For Health
Fair Value US$16.12|24.9% undervalued
NV
Community Contributor
TMX Group will thrive with 33.3% profit margin and enduring market moat
Fair Value CA$49.90|3.3% overvalued
LI
Community Contributor
The "Molecular Pencil": Why Beam's Technology is Built to Win
Fair Value US$65.01|64.5% undervalued
DA
Community Contributor