Advertisement
- United States
- /
- Food
- /
- NYSEAM:SEB
A Look at Seaboard's (SEB) Valuation Following Earnings Turnaround and New Dividend Announcement

Simply Wall St
Reviewed by Simply Wall St
Seaboard (SEB) shared its third quarter and nine-month 2025 results, turning prior losses into net income gains. The company also reported increased revenues year on year and declared a quarterly cash dividend of $2.25 per share.
See our latest analysis for Seaboard.
Seaboard’s strong quarterly turnaround and the new dividend appear to have powered a surge in interest, with the stock’s share price up nearly 49% year to date. However, looking at the bigger picture, its one-year total shareholder return stands at 33.7%, showing that recent momentum is building, even after a mixed longer-term record.
If Seaboard’s recent jump has you eyeing broader opportunities, it might be the perfect time to discover fast growing stocks with high insider ownership.
Following this impressive rebound and the stock’s sharp rally, the big question now is whether Seaboard is trading at a bargain or if the market has already factored in next year’s expected growth and profits.
Price-to-Earnings of 8.7x: Is it justified?
Seaboard’s current price-to-earnings ratio sits at 8.7x, which is well below the last close price’s implied valuation versus industry peers. This lower multiple suggests the stock is trading at a discount in relation to its recent rally.
The price-to-earnings (P/E) ratio compares a company’s share price to its earnings per share and is widely used to gauge investor sentiment about future growth and profitability, especially for established food sector giants like Seaboard. A lower P/E may indicate the market is cautious, or the company’s earnings are expected to remain steady rather than accelerate quickly.
Currently, Seaboard’s P/E is substantially lower than both its US Food industry average (17.8x) and the peer group average (22.2x). This sharp discount stands out, especially considering the company’s blockbuster recent earnings growth following a prolonged earnings decline. It could be a sign that the market is not fully crediting its turnaround just yet.
See what the numbers say about this price — find out in our valuation breakdown.
Result: Price-to-Earnings of 8.7x (UNDERVALUED)
However, Seaboard faces risks if earnings stumble again or if global food industry conditions worsen, which could challenge the sustainability of its current momentum.
Find out about the key risks to this Seaboard narrative.
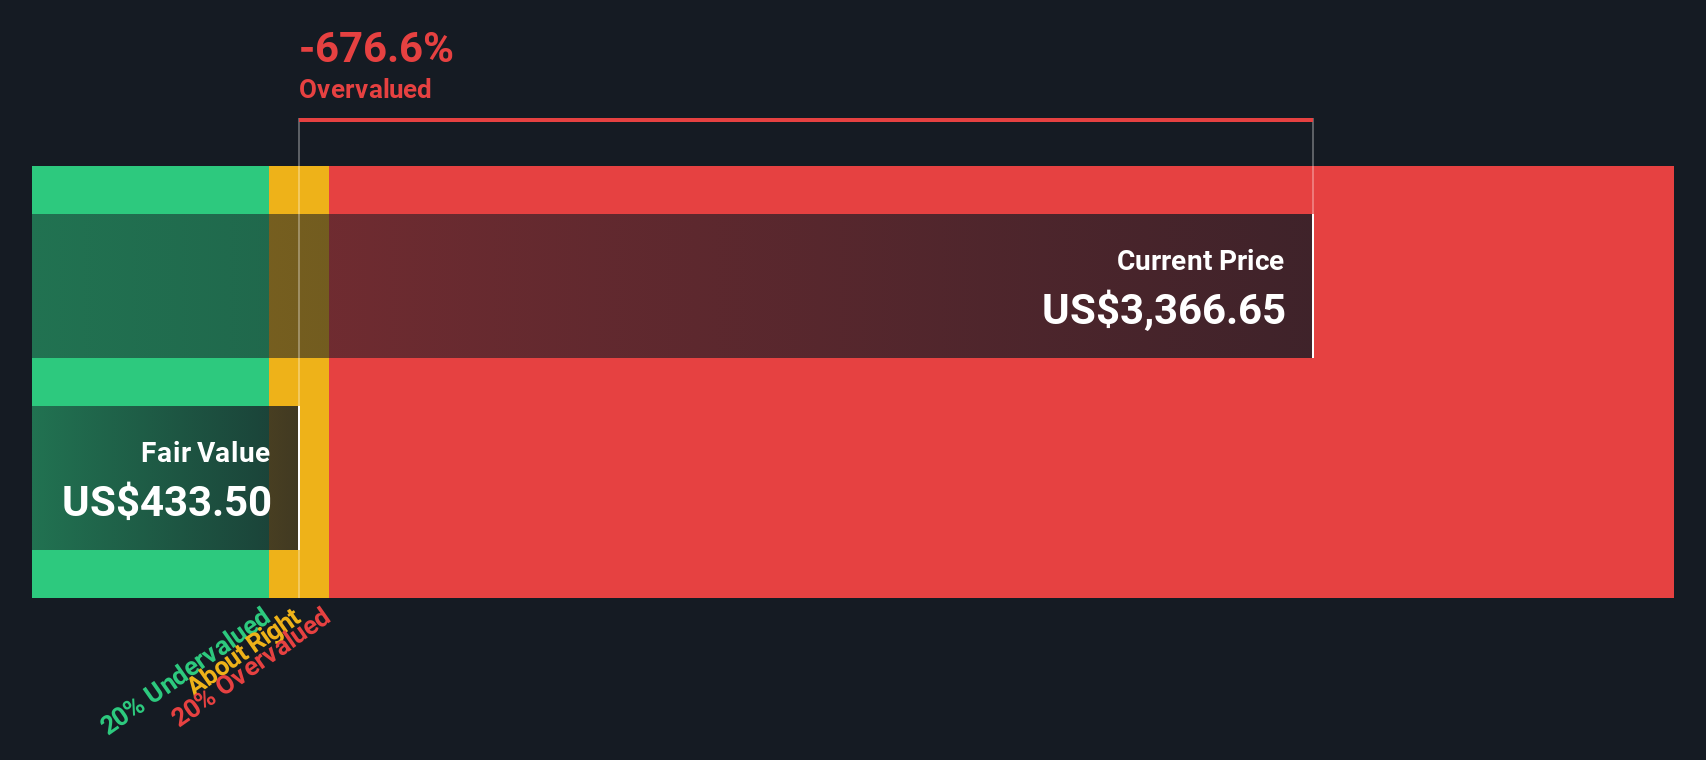
Another View: Discounted Cash Flow Raises Questions
While Seaboard’s low price-to-earnings ratio suggests undervaluation, our SWS DCF model presents a different perspective. According to this model, Seaboard’s current share price of $3,606.5 is significantly higher than the estimated fair value of $1,434.52. This suggests the stock may actually be overvalued.
Look into how the SWS DCF model arrives at its fair value.
Simply Wall St performs a discounted cash flow (DCF) on every stock in the world every day (check out Seaboard for example). We show the entire calculation in full. You can track the result in your watchlist or portfolio and be alerted when this changes, or use our stock screener to discover 840 undervalued stocks based on their cash flows. If you save a screener we even alert you when new companies match - so you never miss a potential opportunity.
Build Your Own Seaboard Narrative
If you see things differently or want to dig into the numbers firsthand, you can easily shape your view of Seaboard’s story in just a few minutes. Do it your way.
A great starting point for your Seaboard research is our analysis highlighting 2 key rewards and 1 important warning sign that could impact your investment decision.
Looking for more investment ideas?
Smart investors seize every opportunity. Don’t miss your chance to find new stocks with untapped potential, dependable income, or breakthrough innovation. Start now before the market moves on.
- Supercharge your search for strong, steady income by checking out these 20 dividend stocks with yields > 3% featuring stocks with yields over 3% and solid fundamentals.
- Unlock early-stage companies showing real promise with these 3604 penny stocks with strong financials and spot the next small-cap winners before they take off.
- Capitalize on the rising tide of AI advancements by targeting these 26 AI penny stocks making big moves in artificial intelligence and automation.
This article by Simply Wall St is general in nature. We provide commentary based on historical data and analyst forecasts only using an unbiased methodology and our articles are not intended to be financial advice. It does not constitute a recommendation to buy or sell any stock, and does not take account of your objectives, or your financial situation. We aim to bring you long-term focused analysis driven by fundamental data. Note that our analysis may not factor in the latest price-sensitive company announcements or qualitative material. Simply Wall St has no position in any stocks mentioned.
New: Manage All Your Stock Portfolios in One Place
We've created the ultimate portfolio companion for stock investors, and it's free.
• Connect an unlimited number of Portfolios and see your total in one currency
• Be alerted to new Warning Signs or Risks via email or mobile
• Track the Fair Value of your stocks
Have feedback on this article? Concerned about the content? Get in touch with us directly. Alternatively, email editorial-team@simplywallst.com
About NYSEAM:SEB
Seaboard
Operates in agricultural, energy, and ocean transportation business worldwide.
Excellent balance sheet with proven track record.
Similar Companies
Market Insights

Advertisement
Community Narratives
The company that turned a verb into a global necessity and basically runs the modern internet, digital ads, smartphones, maps, and AI.
Fair Value US$300.00|7.5% undervalued
OS
Community Contributor
Flowers Foods Pays A Fair Price For Health
Fair Value US$16.12|25.4% undervalued
NV
Community Contributor
TMX Group will thrive with 33.3% profit margin and enduring market moat
Fair Value CA$49.90|3.6% overvalued
LI
Community Contributor
The "Molecular Pencil": Why Beam's Technology is Built to Win
Fair Value US$65.01|65.0% undervalued
DA
Community Contributor