Advertisement
- United States
- /
- Food
- /
- NYSE:GIS
Is General Mills a Bargain After 26% Stock Slide in 2025?

Simply Wall St
Reviewed by Bailey Pemberton
- Wondering if General Mills stock is finally a bargain, or still priced for perfection? You are not alone. Getting clear on value is key to making smart moves with established brands like this.
- After some steady declines, General Mills' share price has fallen 1.7% over the past week and is down 8.1% for the month, deepening a challenging year that has seen the stock drop 26.6% year-to-date.
- News of shifting consumer preferences and big competitors increasing their innovations have kept General Mills in the headlines, fueling debate about how well it can defend its market share. Recently, conversations about changing food trends and the company's responses have added to the uncertainty around the stock's future direction.
- On the valuation front, General Mills earns a solid 5 out of 6 on our value score, suggesting it looks undervalued on almost every metric. There are several ways to assess its worth, and later in the article we will explore which methods matter most, as well as a smarter approach to value that investors often overlook.
Find out why General Mills's -28.6% return over the last year is lagging behind its peers.
Approach 1: General Mills Discounted Cash Flow (DCF) Analysis
The Discounted Cash Flow (DCF) method values a business by projecting its future cash flows and discounting them back to today’s dollars. This provides investors with an estimate of the company's intrinsic value, based on how much cash it is expected to generate in the years ahead.
For General Mills, the most recent reported Free Cash Flow (FCF) stands at just over $2.0 billion. Analysts have offered growth projections for the next five years that suggest this cash flow will steadily rise, with Simply Wall St extrapolating these trends out to 2035. By 2029, the company's FCF is estimated to reach $2.29 billion, and by 2035 it could top $2.73 billion according to these forecasts.
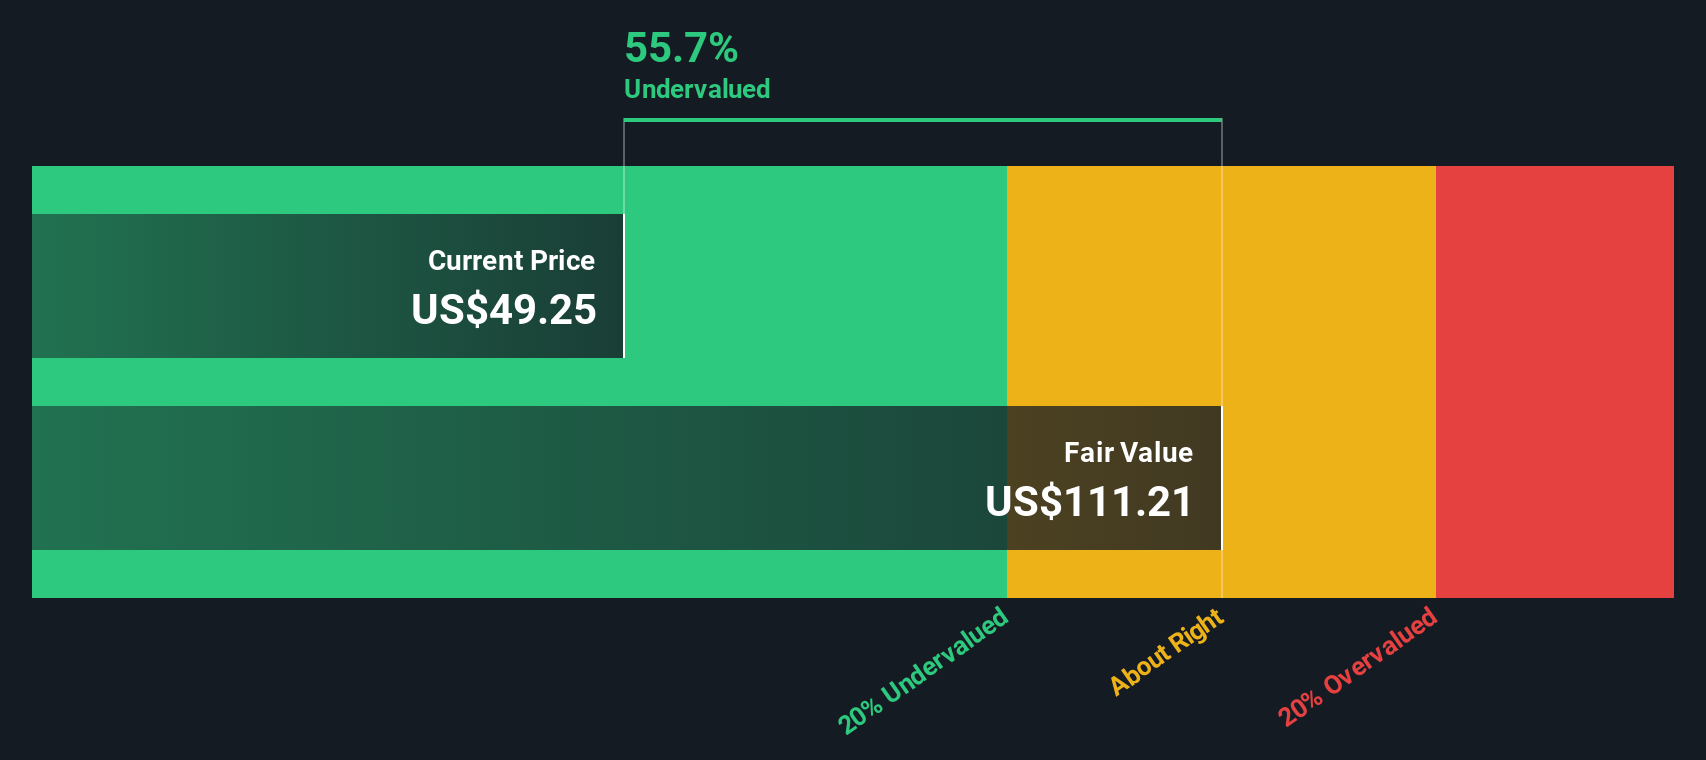
After discounting all future projected cash flows back to the present, the DCF valuation calculates an intrinsic value of $104.80 per share for General Mills. Given the current share price is trading at a 55.5% discount to this estimated value, the analysis points to a stock that is significantly undervalued at current levels.
Result: UNDERVALUED
Our Discounted Cash Flow (DCF) analysis suggests General Mills is undervalued by 55.5%. Track this in your watchlist or portfolio, or discover 832 more undervalued stocks based on cash flows.
Approach 2: General Mills Price vs Earnings
The Price-to-Earnings (PE) ratio is the market’s classic yardstick for valuing profitable companies like General Mills. It tells investors how much they are paying for each dollar of current earnings, making it a quick and simple way to compare valuation across similar businesses.
Generally, the “right” PE ratio depends on expected growth rates, company risk, and overall industry conditions. Companies with higher growth or lower risk often justify higher PE multiples, while slow growers or riskier businesses command lower ones.
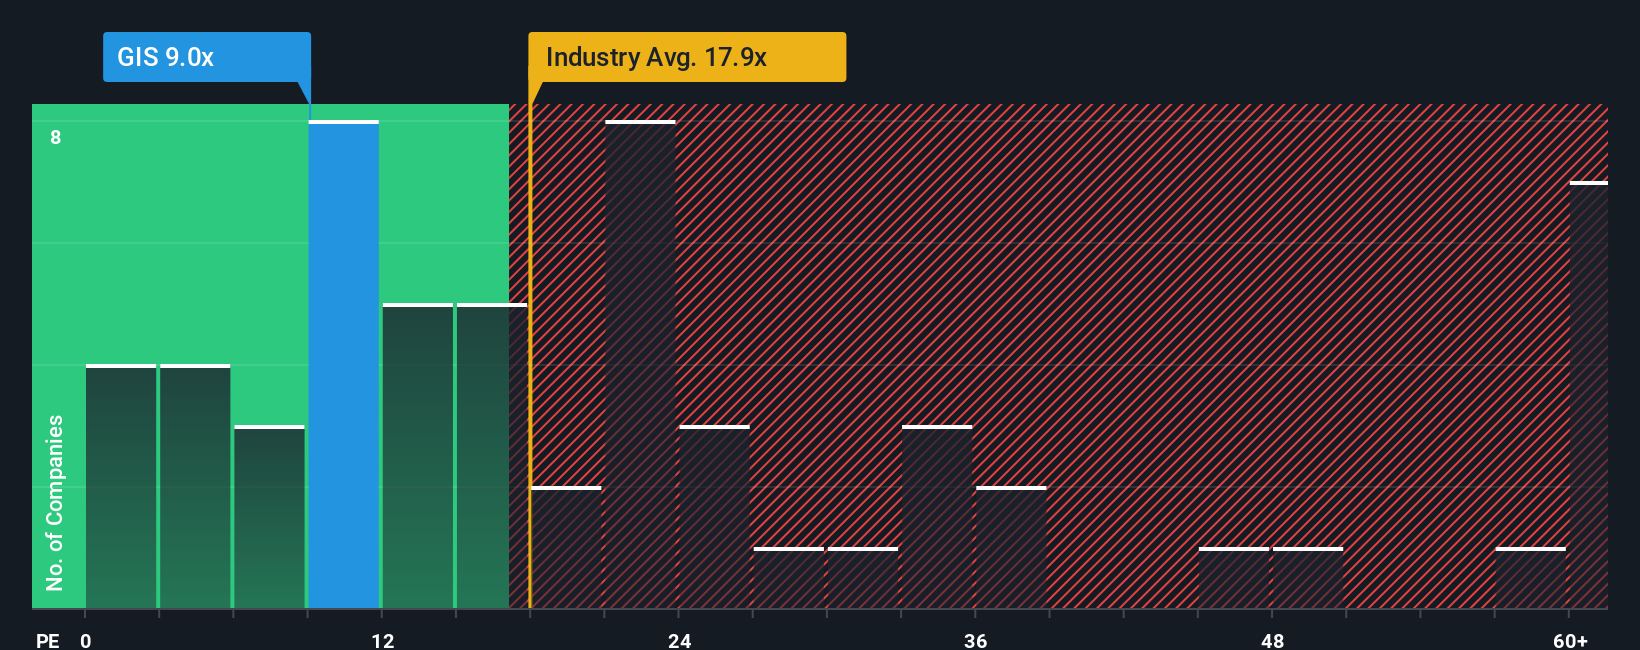
Currently, General Mills is trading at a PE ratio of just 8.5x. This is well below both the food industry average of 17.8x and the average of its peers, which sits even higher at 23.3x. Such a deep discount might initially look like a bargain, but industry-wide averages do not always tell the full story for an individual company.
This is where Simply Wall St’s proprietary “Fair Ratio” comes in. The Fair Ratio, calculated as 12.2x for General Mills, reflects not just what others in the industry are paying but also factors in company-specific elements such as growth prospects, risk profile, profit margins, and market cap. In short, it aims to set a tailored benchmark for what General Mills’ PE ratio should be, rather than relying on one-size-fits-all comparisons.
Given that General Mills is trading at 8.5x compared to a Fair Ratio of 12.2x, the stock appears to be undervalued based on this more nuanced approach.
Result: UNDERVALUED
PE ratios tell one story, but what if the real opportunity lies elsewhere? Discover 1410 companies where insiders are betting big on explosive growth.
Upgrade Your Decision Making: Choose your General Mills Narrative
Earlier we mentioned that there is an even better way to understand valuation, so let's introduce you to Narratives. A Narrative is more than just numbers; it is the story behind a company's potential, blending your perspective on General Mills' future with assumptions about its revenue, earnings, and margins to estimate what the stock is truly worth.
Narratives link a company's business story directly to financial forecasts and then to a fair value, making your investment process more meaningful and personal. You do not need to be an expert. Simply Wall St's Narratives are a simple, accessible tool, featured within the Community page and used by millions of investors to see new perspectives and share their own.
By creating or following Narratives, you can quickly see if you believe General Mills is a buy or sell: just compare your assumed Fair Value with the current share price, and decide if there is enough margin of safety. The best part is that Narratives are automatically updated every time major news or earnings reports are released, so your viewpoint always stays relevant.
For example, with General Mills, one investor might set a fair value of $63 based on long-term brand strength and aggressive innovation, while another focuses on short-term challenges and assigns a fair value of just $45, letting you see exactly where your view fits on the spectrum.
Do you think there's more to the story for General Mills? Head over to our Community to see what others are saying!
This article by Simply Wall St is general in nature. We provide commentary based on historical data and analyst forecasts only using an unbiased methodology and our articles are not intended to be financial advice. It does not constitute a recommendation to buy or sell any stock, and does not take account of your objectives, or your financial situation. We aim to bring you long-term focused analysis driven by fundamental data. Note that our analysis may not factor in the latest price-sensitive company announcements or qualitative material. Simply Wall St has no position in any stocks mentioned.
New: Manage All Your Stock Portfolios in One Place
We've created the ultimate portfolio companion for stock investors, and it's free.
• Connect an unlimited number of Portfolios and see your total in one currency
• Be alerted to new Warning Signs or Risks via email or mobile
• Track the Fair Value of your stocks
Have feedback on this article? Concerned about the content? Get in touch with us directly. Alternatively, email editorial-team@simplywallst.com
About NYSE:GIS
6 star dividend payer and undervalued.
Similar Companies
Market Insights

Advertisement
Community Narratives
The company that turned a verb into a global necessity and basically runs the modern internet, digital ads, smartphones, maps, and AI.
Fair Value US$300.00|6.3% undervalued
OS
Community Contributor
Flowers Foods Pays A Fair Price For Health
Fair Value US$16.12|26.0% undervalued
NV
Community Contributor
TMX Group will thrive with 33.3% profit margin and enduring market moat
Fair Value CA$49.90|3.7% overvalued
LI
Community Contributor