Venture Global (VG) shares have tracked lower over the past month, losing more than 44%. However, its annual growth figures for revenue and profit remain positive. Investors may be watching for clues about the company’s longer-term trajectory.
Venture Global’s share price momentum has faded sharply in recent weeks, with a 30-day share price return of -44.4%. The stock’s slide since the start of the year points to shifting investor sentiment, even as underlying growth remains intact.
With the stock trading at a steep discount to analyst targets and underlying growth still visible, the big question for investors is whether Venture Global is now undervalued or if the market has fully priced in its future prospects.
Advertisement
Price-to-Earnings of 14.6x: Is it justified?
Venture Global’s shares are trading at a price-to-earnings (P/E) ratio of 14.6x, compared to its last close price of $7.75. This level suggests a valuation that requires closer scrutiny given mixed signals. The stock trades below some value metrics, but the P/E is not necessarily cheap.
The price-to-earnings ratio compares a company’s current share price to its per-share earnings. This makes it a crucial indicator of how much investors are paying for each dollar of profit. For Venture Global, this metric puts its profitability, future growth potential, and the market’s expectations clearly in the spotlight.
Currently, Venture Global’s P/E ratio is meaningfully lower than its peer group’s average of 23.8x, which typically signals undervaluation. However, when contrasted with the broader US Oil and Gas industry’s average of 12.8x, Venture Global trades at a premium. In addition, based on the calculated “fair” P/E ratio of 12x, the current multiple implies some optimism is still embedded in the shares. Investors should weigh whether the company’s fundamentals can justify this higher-than-industry but lower-than-peers pricing.
However, slowing net income growth and persistent negative share price momentum could signal deeper concerns that may challenge Venture Global's current valuation thesis.
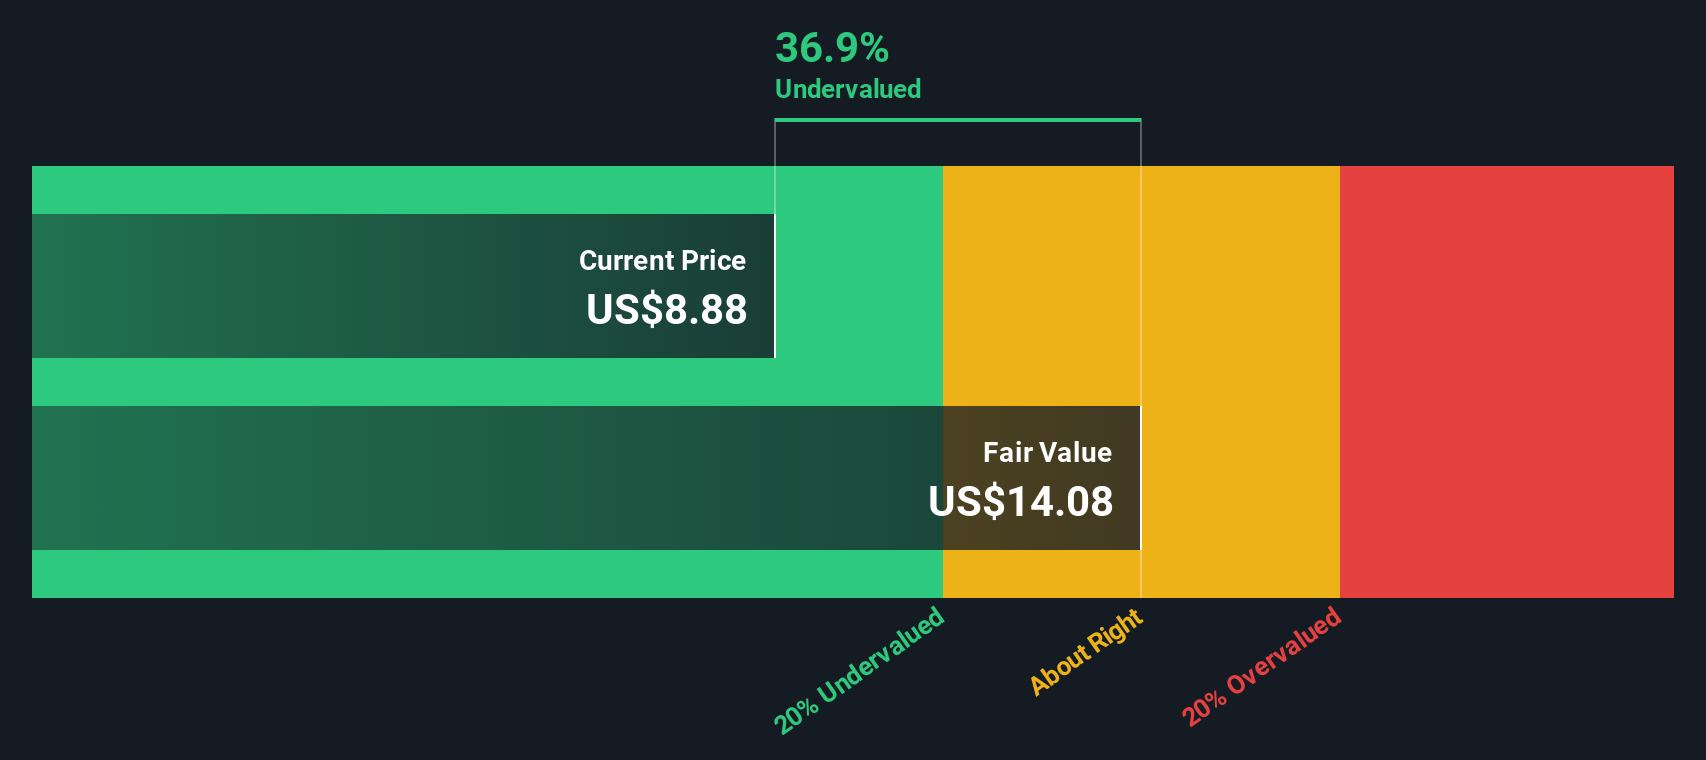
Another View: Discounted Cash Flow Says Undervalued
Taking a different approach, the SWS DCF model suggests Venture Global’s fair value could be $15.39, which is nearly double its current share price. This signals the market might be overlooking long-term cash flow potential. However, does this indicate a clear opportunity, or could risks still weigh the stock down?
If you see the story differently or want to dig into the numbers yourself, you can shape your own view in just a few minutes with Do it your way.
A great starting point for your Venture Global research is our analysis highlighting 2 key rewards and 2 important warning signs that could impact your investment decision.
Looking for more investment ideas?
Don’t wait for the market to move without you. Get ahead by using Simply Wall Street’s powerful screeners and spot investment opportunities other investors might overlook.
Tap into steady income by checking out these 20 dividend stocks with yields > 3%, which features yields climbing above 3% and resilient business models that reward shareholders.
Catch the next AI leader early on as you survey these 26 AI penny stocks, featuring innovative companies transforming technology and everyday life.
This article by Simply Wall St is general in nature. We provide commentary based on historical data
and analyst forecasts only using an unbiased methodology and our articles are not intended to be financial advice. It does not constitute a recommendation to buy or sell any stock, and does not take account of your objectives, or your
financial situation. We aim to bring you long-term focused analysis driven by fundamental data.
Note that our analysis may not factor in the latest price-sensitive company announcements or qualitative material.
Simply Wall St has no position in any stocks mentioned.
New: Manage All Your Stock Portfolios in One Place
We've created the ultimate portfolio companion for stock investors, and it's free.
• Connect an unlimited number of Portfolios and see your total in one currency • Be alerted to new Warning Signs or Risks via email or mobile • Track the Fair Value of your stocks