Advertisement
- United States
- /
- Oil and Gas
- /
- NasdaqCM:NEXT
NextDecade (NEXT): Evaluating Valuation Following Latest Quarterly Earnings and Widened Year-to-Date Losses

Simply Wall St
Reviewed by Simply Wall St
NextDecade (NEXT) just shared its third quarter earnings, showing a net loss of $109 million. This loss is smaller than last year’s loss for the same period, though losses for the year have widened.
See our latest analysis for NextDecade.
NextDecade’s latest earnings update arrives after a challenging stretch for shareholders, with a 1-day share price gain of 2.77% barely making a dent in the stock’s broader slide. The 90-day share price return stands at -46.58%. Despite this recent volatility, patient investors have still enjoyed an impressive 170.78% total shareholder return over the past five years, showing how fortunes can shift as momentum ebbs and flows.
If watching NEXT’s turnaround has you wondering what else is out there, now is a great time to broaden your search and discover fast growing stocks with high insider ownership
With shares trading well below analysts’ price targets and a volatile performance behind it, the key question now is whether NextDecade is undervalued at these levels or if the market has already priced in future growth prospects.
Price-to-Book of 10.1x: Is it justified?
NextDecade currently trades at a price-to-book ratio of 10.1x, which positions it significantly above both its peer group and industry averages based on the last close price of $5.93. This high valuation multiple suggests investors are pricing in robust expectations for the future, despite the company being unprofitable and reporting negligible revenue.
The price-to-book ratio compares the market value of a company's equity to its book value. In sectors like oil and gas, this ratio can reflect expectations for future asset growth, profitability, or potential project pipeline value. For NextDecade, the elevated multiple is fueled more by optimism for future growth projects than current earnings power.
Relative to the US oil and gas industry average of just 1.3x, NextDecade's 10.1x price-to-book stands out as strikingly expensive. Compared to direct peers, a peer group average of 1.9x further highlights how much higher investors are paying for NextDecade relative to book value.
See what the numbers say about this price — find out in our valuation breakdown.
Result: Preferred multiple of 10.1x Price-to-Book (OVERVALUED)
However, risks like negligible current revenue and ongoing net losses could quickly shift sentiment if NextDecade's future growth projects disappoint or experience delays.
Find out about the key risks to this NextDecade narrative.
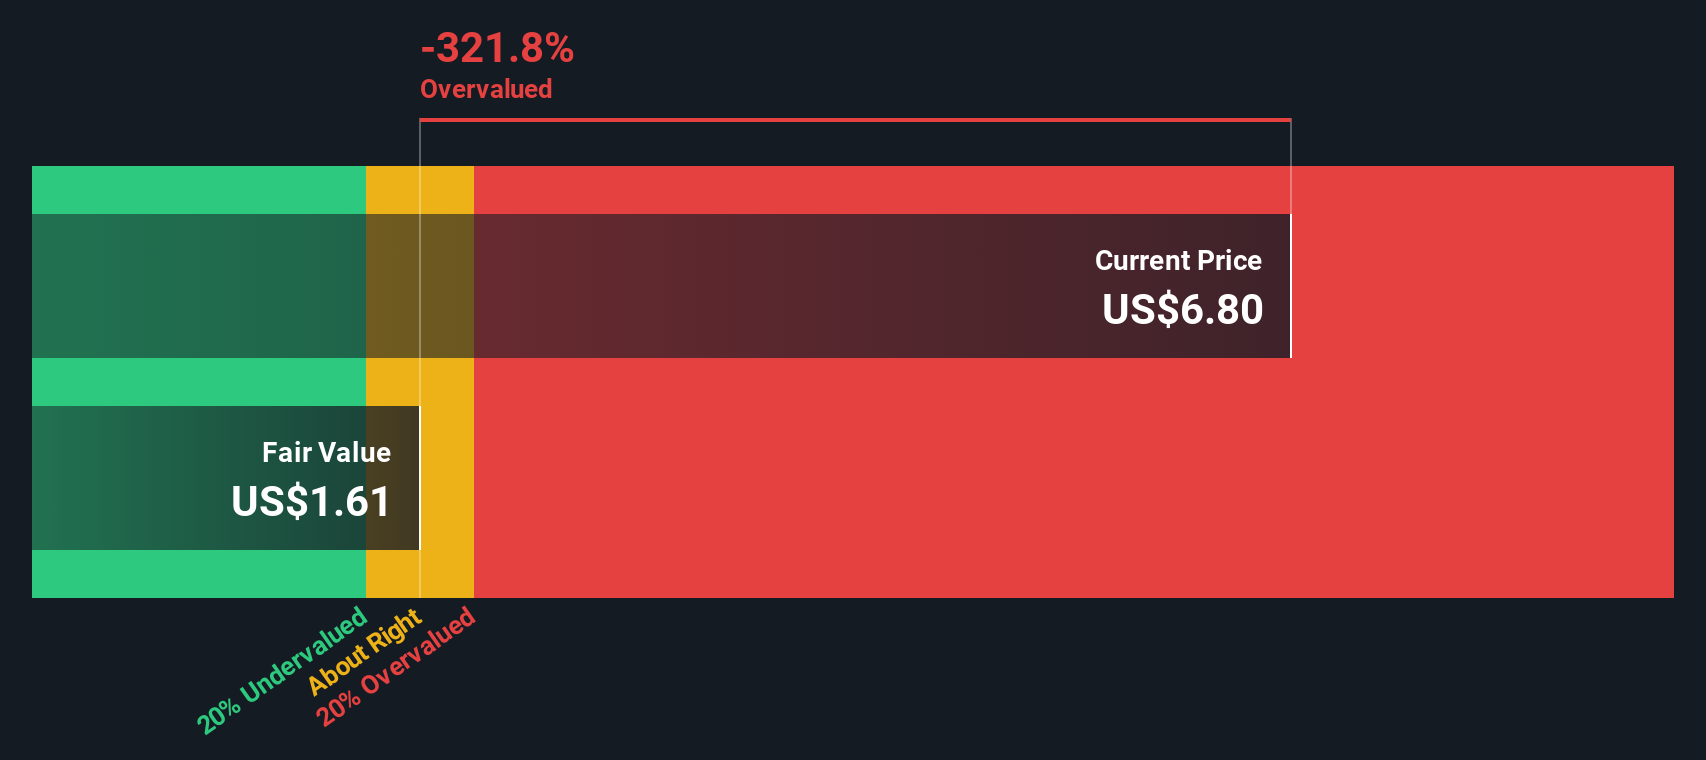
Another View: Our DCF Model Tells a Different Story
While the market’s high price-to-book ratio suggests optimism for NextDecade, our DCF model estimates fair value at just $1.63, which is well below the current price of $5.93. This significant difference raises important questions about whether growth expectations are overdone or if the market sees something models cannot.
Look into how the SWS DCF model arrives at its fair value.
Simply Wall St performs a discounted cash flow (DCF) on every stock in the world every day (check out NextDecade for example). We show the entire calculation in full. You can track the result in your watchlist or portfolio and be alerted when this changes, or use our stock screener to discover 833 undervalued stocks based on their cash flows. If you save a screener we even alert you when new companies match - so you never miss a potential opportunity.
Build Your Own NextDecade Narrative
If you have a different perspective or want to dig deeper into the numbers yourself, you can craft your own narrative quickly and easily: Do it your way
A great starting point for your NextDecade research is our analysis highlighting 1 key reward and 4 important warning signs that could impact your investment decision.
Looking for more investment ideas?
Don’t miss out on top opportunities. The market keeps moving, and so can your portfolio when you tap into expertly curated themes tailored to where trends are heading next.
- Jump on income opportunities and check out these 22 dividend stocks with yields > 3% offering impressive yields above 3% for confident long-term growth.
- Capitalize on game-changing technology advancements by browsing these 26 AI penny stocks with the potential to transform entire industries.
- Secure your edge by researching these 833 undervalued stocks based on cash flows where strong cash flow points toward untapped upside others may be missing.
This article by Simply Wall St is general in nature. We provide commentary based on historical data and analyst forecasts only using an unbiased methodology and our articles are not intended to be financial advice. It does not constitute a recommendation to buy or sell any stock, and does not take account of your objectives, or your financial situation. We aim to bring you long-term focused analysis driven by fundamental data. Note that our analysis may not factor in the latest price-sensitive company announcements or qualitative material. Simply Wall St has no position in any stocks mentioned.
Valuation is complex, but we're here to simplify it.
Discover if NextDecade might be undervalued or overvalued with our detailed analysis, featuring fair value estimates, potential risks, dividends, insider trades, and its financial condition.
Access Free AnalysisHave feedback on this article? Concerned about the content? Get in touch with us directly. Alternatively, email editorial-team@simplywallst.com
About NasdaqCM:NEXT
NextDecade
An energy company, engages in the construction and development activities related to the liquefaction of natural gas in the United States.
Slight risk with limited growth.
Similar Companies
Market Insights

Advertisement
Community Narratives
The company that turned a verb into a global necessity and basically runs the modern internet, digital ads, smartphones, maps, and AI.
Fair Value US$300.00|6.3% undervalued
OS
Community Contributor
Flowers Foods Pays A Fair Price For Health
Fair Value US$16.12|26.0% undervalued
NV
Community Contributor
TMX Group will thrive with 33.3% profit margin and enduring market moat
Fair Value CA$49.90|3.7% overvalued
LI
Community Contributor