Advertisement
- United States
- /
- Capital Markets
- /
- NYSE:STT
Assessing State Street After Digital Custody Expansion and 17% Year-to-Date Increase

Simply Wall St
Reviewed by Bailey Pemberton
- Curious if State Street is a compelling buy right now? You are not alone, especially with volatility driving fresh questions about the stock’s true value.
- Although State Street dipped 2.1% this week, it is still up 1.0% in the last month and has achieved a 16.8% gain so far this year, with a steady 21.0% climb over the past twelve months.
- Recent headlines have focused on State Street’s expansion of digital custody capabilities and high-profile collaborations in the fintech space. These moves are being watched closely by investors, as they may shift both growth potential and risk perception for the months ahead.
- Right now, State Street scores a 4 out of 6 on our undervalued checks, suggesting there is already value for bargain hunters. Stay tuned as we explore the different ways valuation is measured, and why there may be an even smarter angle to consider by the end of this article.
Approach 1: State Street Excess Returns Analysis
The Excess Returns model evaluates how efficiently a company generates profit relative to the cost of its equity capital. By focusing on the difference between State Street’s return on invested capital and its cost of equity, this method provides an intrinsic value assessment that goes beyond simple earnings or cash flow multiples.
For State Street, recent analyst estimates project a stable book value of $93.92 per share and a stable earnings per share (EPS) of $12.04. The average return on equity is 12.82%, which comfortably exceeds the cost of equity at $9.14 per share. This results in an annual excess return of $2.90 per share, evidence that State Street’s investments are delivering value above their capital cost.
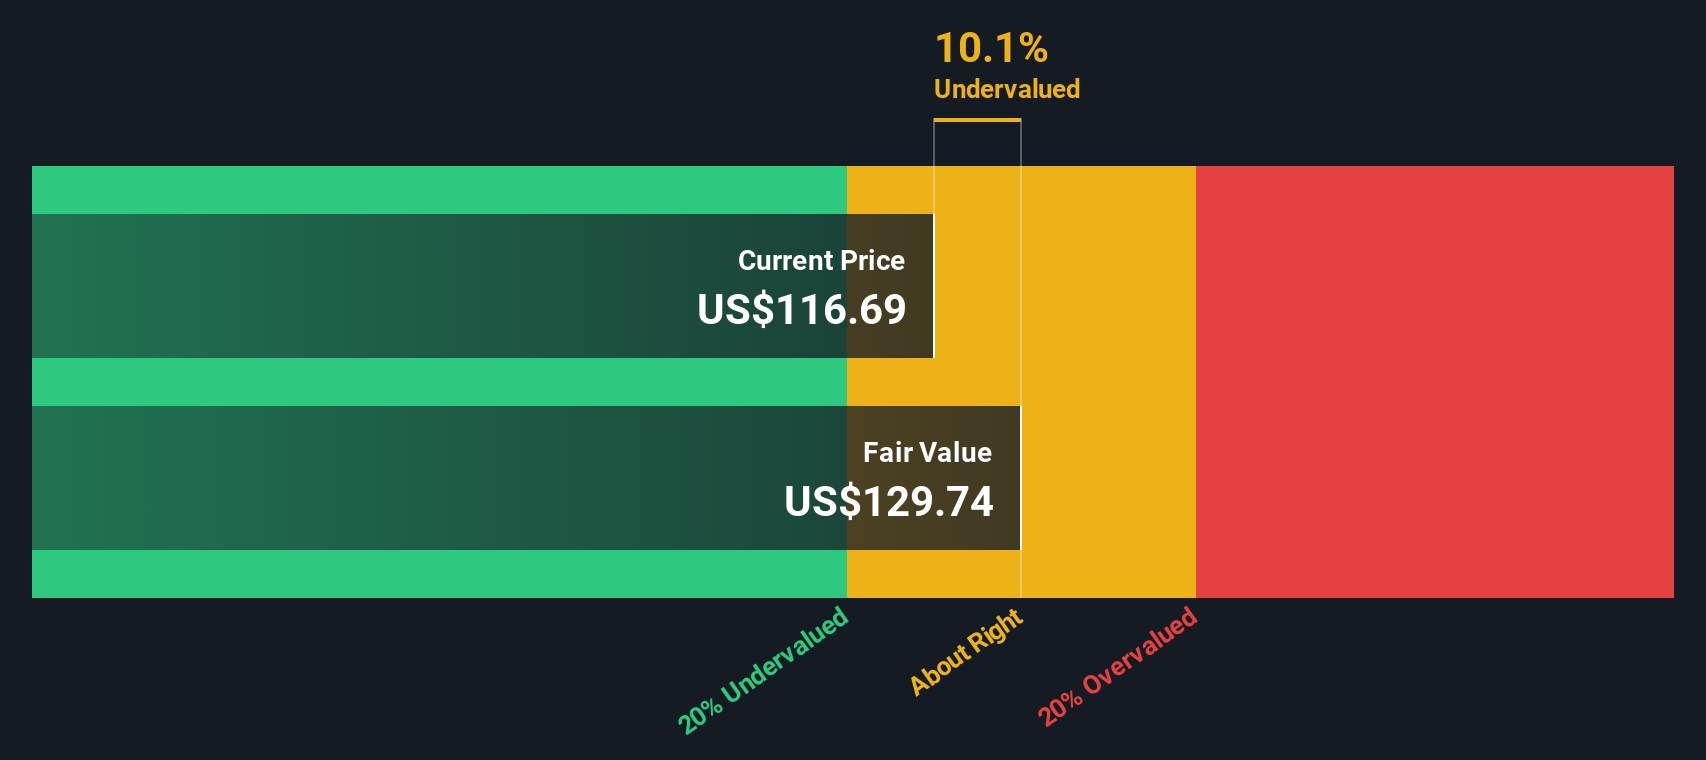
With these inputs, the Excess Returns model produces an estimated intrinsic value of $138.81 per share. Compared to the current market price, this suggests the stock is around 17.6% undervalued based on this methodology and may present a potential bargain opportunity for investors focused on return efficiency and capital allocation.
Result: UNDERVALUED
Our Excess Returns analysis suggests State Street is undervalued by 17.6%. Track this in your watchlist or portfolio, or discover 917 more undervalued stocks based on cash flows.
Approach 2: State Street Price vs Earnings
The Price-to-Earnings (PE) ratio is widely recognized as a reliable valuation metric for profitable companies such as State Street. It relates the stock price to its earnings power and tells investors how much they are paying for each dollar of profit, making it a direct and intuitive benchmark for comparing valuation.
Growth expectations and risk levels are key drivers of what constitutes a “normal” or “fair” PE ratio. Companies expected to deliver faster earnings growth or those with lower risk profiles typically command higher PE ratios, reflecting investors’ willingness to pay more for future profits.
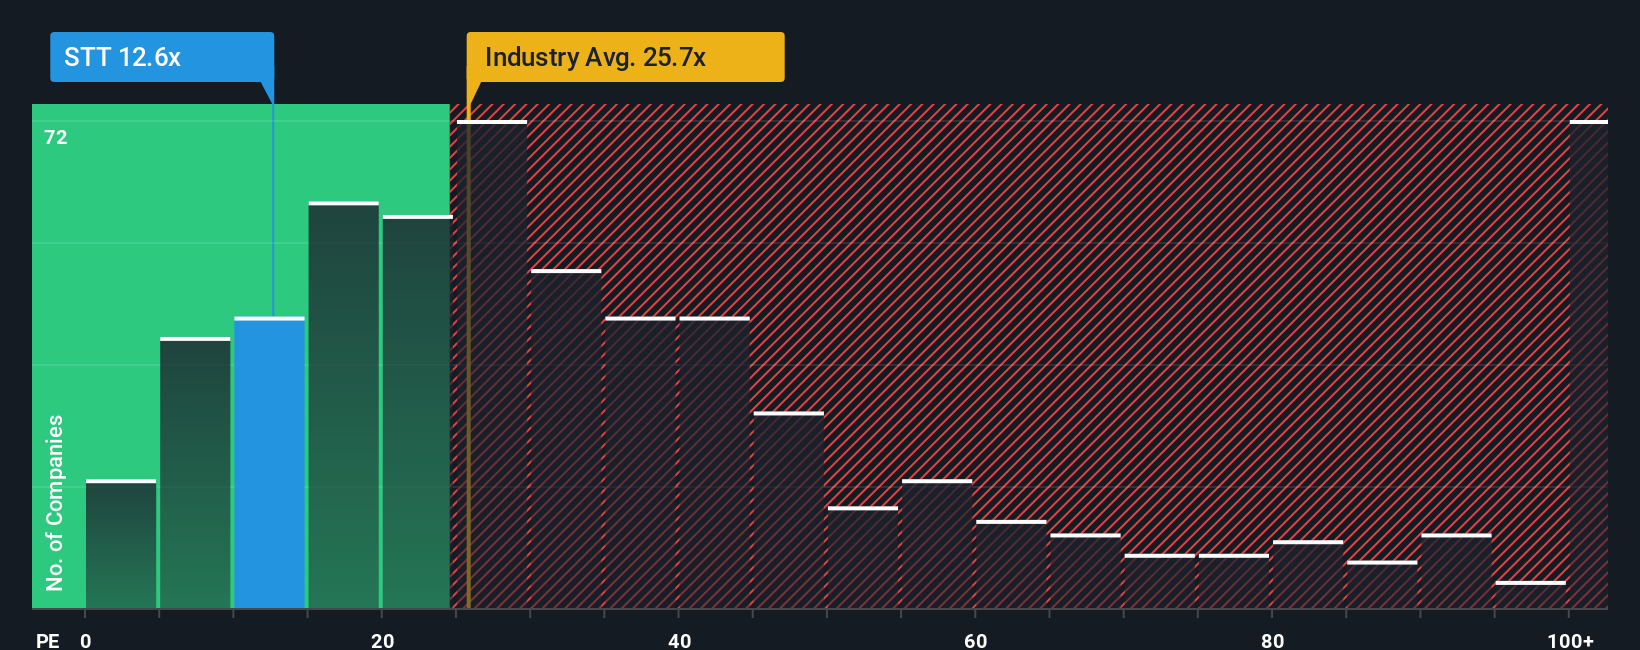
State Street currently trades at a PE ratio of 11.6x. This stands well below the Capital Markets industry average of 23.6x and is also lower than the average among its closest peers at 16.2x. On Simply Wall St’s platform, the “Fair Ratio” for State Street is assessed to be 16.0x, which incorporates not only typical industry and peer comparisons but also company-specific factors like expected earnings growth, profit margins, and its overall risk profile and size.
The advantage of using Simply Wall St’s Fair Ratio is that it tailors the valuation benchmark to State Street’s unique characteristics instead of just relying on broad comparisons that may not fully reflect the company’s prospects and risks.
With State Street’s current PE of 11.6x versus a Fair Ratio of 16.0x, the stock appears undervalued on this basis, suggesting potential upside if its valuation converges toward fair value.
Result: UNDERVALUED
PE ratios tell one story, but what if the real opportunity lies elsewhere? Discover 1422 companies where insiders are betting big on explosive growth.
Upgrade Your Decision Making: Choose your State Street Narrative
Earlier we mentioned that there is an even better way to think about valuation, so let’s introduce you to Narratives, a game-changing, story-driven approach that helps investors see the bigger picture behind a company’s numbers.
A Narrative is simply your perspective on State Street’s future, combining your own expectations for its revenues, earnings, and profit margins to craft a story that explains why you believe the stock is worth more, or less, than today’s price.
On Simply Wall St’s Community page, millions of investors use Narratives to link their outlook and assumptions for the company directly to a forecast and a Fair Value estimate. This creates an easy and accessible decision-making tool that anyone can use, not just professionals.
This means you can instantly compare your Fair Value with the market price, making it much simpler to judge if State Street is a buy, hold, or sell. Your Narrative also updates automatically as new earnings or news are released, keeping your view current without extra effort.
For example, some investors see upside for State Street if ETF flows and fee growth accelerate (targeting a Fair Value of $131.0), while others focus on regulatory risk or tech disruption and arrive at a more cautious outlook (Fair Value $95.0). Your Narrative puts your story and scenarios at the center of your investing decision.
Do you think there's more to the story for State Street? Head over to our Community to see what others are saying!

This article by Simply Wall St is general in nature. We provide commentary based on historical data and analyst forecasts only using an unbiased methodology and our articles are not intended to be financial advice. It does not constitute a recommendation to buy or sell any stock, and does not take account of your objectives, or your financial situation. We aim to bring you long-term focused analysis driven by fundamental data. Note that our analysis may not factor in the latest price-sensitive company announcements or qualitative material. Simply Wall St has no position in any stocks mentioned.
New: Manage All Your Stock Portfolios in One Place
We've created the ultimate portfolio companion for stock investors, and it's free.
• Connect an unlimited number of Portfolios and see your total in one currency
• Be alerted to new Warning Signs or Risks via email or mobile
• Track the Fair Value of your stocks
Have feedback on this article? Concerned about the content? Get in touch with us directly. Alternatively, email editorial-team@simplywallst.com
About NYSE:STT
State Street
Provides various financial products and services to institutional investors.
Excellent balance sheet established dividend payer.
Similar Companies
Market Insights

Advertisement
Community Narratives
MicroVision will explode future revenue by 380.37% with a vision towards success
Fair Value US$60.00|98.4% undervalued
TH
Community Contributor
The Indispensable Artery for a New North American Economy
Fair Value CA$132.87|1.3% undervalued
TI
Community Contributor