Advertisement
- United States
- /
- Capital Markets
- /
- NYSE:OWL
Should You Rethink Blue Owl Capital After a 30% Drop in 2025?

Simply Wall St
Reviewed by Bailey Pemberton
- Wondering if Blue Owl Capital is a bargain or overhyped? Let’s dig into what’s really going on beneath the surface and why it could matter for your portfolio.
- Although the stock has seen a 2.2% dip over the last week and is still down 30.6% for the year, its three-year return sits at a robust 29.0%. The stock has moved between periods of promise and uncertainty.
- Recently, Blue Owl Capital has been in the spotlight as industry headlines focus on the wave of private credit deals and the company’s growing influence in alternative asset management. While markets react to each new partnership or expansion announcement, these developments provide important context to why the share price has been so volatile.
- When it comes to classic valuation checks, Blue Owl Capital scores just 2 out of 6 for undervaluation right now, according to our framework. In a moment, we'll break down what that really means using several approaches, but stick around to discover a less obvious way to spot value that too many investors overlook.
Blue Owl Capital scores just 2/6 on our valuation checks. See what other red flags we found in the full valuation breakdown.
Approach 1: Blue Owl Capital Excess Returns Analysis
The Excess Returns model evaluates whether a company is generating enough return on its invested capital to exceed the basic cost of that capital, focusing on profitability and the company’s ability to create value for shareholders over time.
For Blue Owl Capital, analysis based on this approach reveals the following key figures:
- Book Value: $3.45 per share
- Stable EPS: $0.14 per share
(Source: Median Return on Equity from the past 5 years.) - Cost of Equity: $0.30 per share
- Excess Return: $-0.16 per share
- Average Return on Equity: 4.07%
- Stable Book Value: $3.50 per share
(Source: Median Book Value from the past 5 years.)
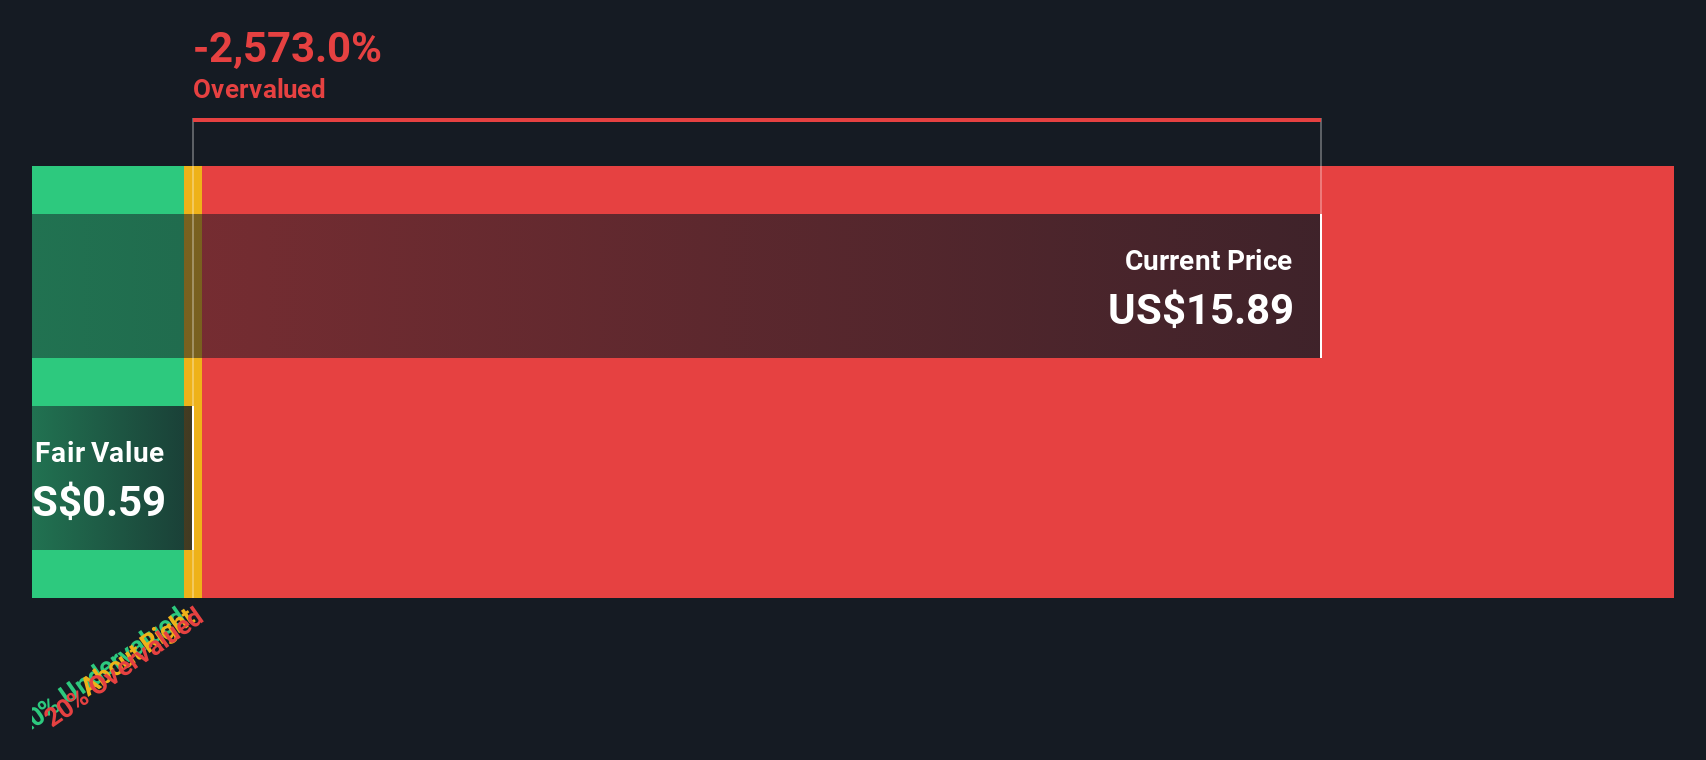
Given these inputs, the Excess Returns model estimates that Blue Owl Capital is significantly overvalued at this time. The implied intrinsic value of the stock is far below the current market price, with an intrinsic discount indicating the stock is 2783.8% overvalued. This suggests the company is not generating returns above its cost of capital, which raises concerns for long-term value creation using this methodology.
Result: OVERVALUED
Our Excess Returns analysis suggests Blue Owl Capital may be overvalued by 2783.8%. Discover 874 undervalued stocks or create your own screener to find better value opportunities.
Approach 2: Blue Owl Capital Price vs Sales
The Price-to-Sales (P/S) ratio is a useful valuation tool for companies like Blue Owl Capital, particularly when analyzing firms with steady revenues in the financial sector. While profitability is important, the P/S ratio allows investors to compare the market value of a company to its actual sales. This provides a broader sense of valuation that is less distorted by atypical profit margins or non-cash charges.
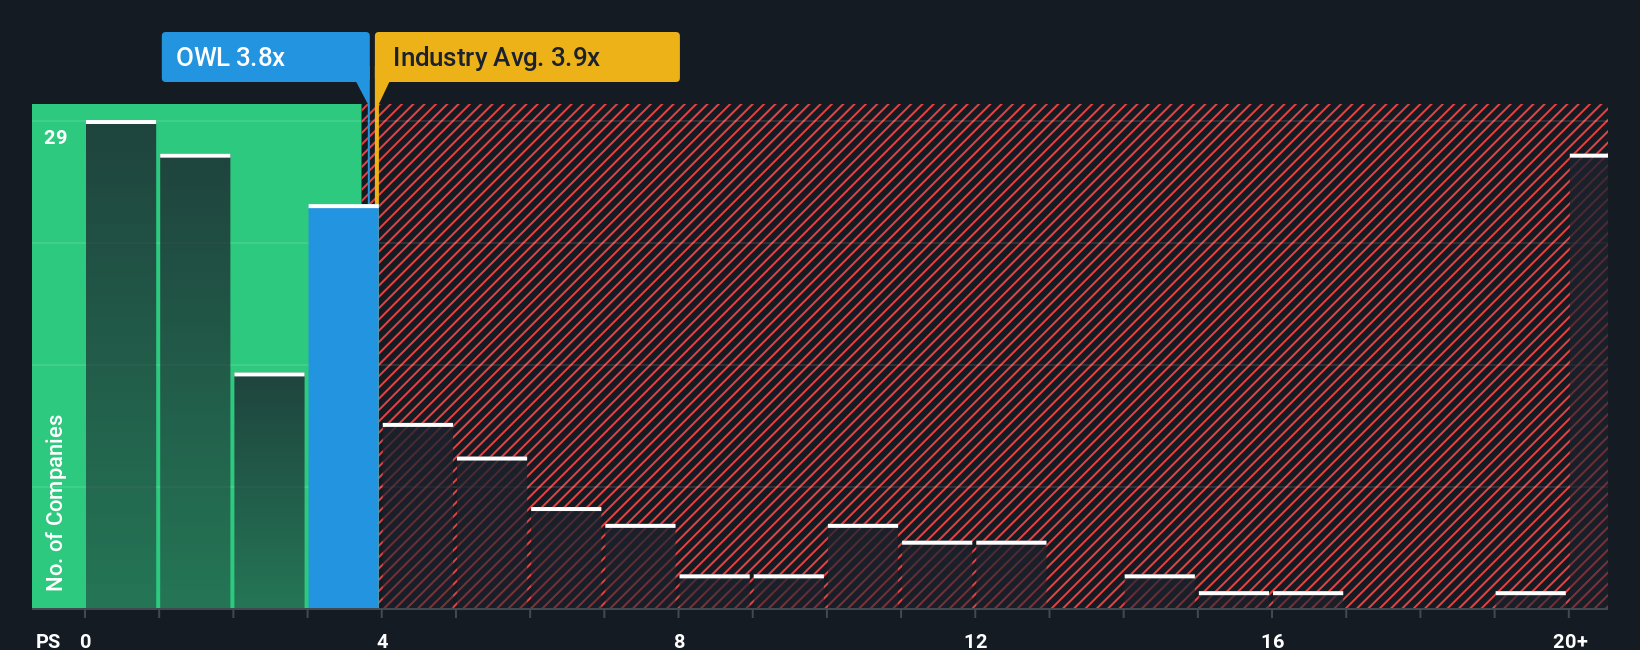
Growth expectations and the level of risk in a company’s business influence what a “normal” or “fair” P/S multiple should look like. Fast-growing or lower-risk companies may command a higher ratio, while mature or riskier firms tend to trade at lower multiples. Looking at Blue Owl Capital’s numbers, the company currently trades at a P/S ratio of 3.74x. This is very similar to both its industry average for Capital Markets at 3.84x and its selected peer group’s average of 3.52x.
Simply Wall St’s proprietary “Fair Ratio” metric is especially helpful here. Unlike a basic comparison against peers or the sector, the Fair Ratio incorporates the company’s individual growth rates, profit margins, risk profile, size, and industry characteristics to generate an appropriate benchmark. For Blue Owl Capital, the Fair Ratio is 4.05x, which is slightly above the company’s current ratio. Since the difference is less than 0.10x, this suggests that Blue Owl Capital is valued ABOUT RIGHT at current levels using the P/S metric.
Result: ABOUT RIGHT
PS ratios tell one story, but what if the real opportunity lies elsewhere? Discover 1404 companies where insiders are betting big on explosive growth.
Upgrade Your Decision Making: Choose your Blue Owl Capital Narrative
Earlier we mentioned there is an even better way to understand valuation, so let us introduce you to Narratives. A Narrative is simply your personal story or thesis about where you think a company is heading, built by combining your expectations for its future revenue, earnings, and profit margins with the numbers behind its fair value. Instead of just relying on static metrics or consensus price targets, Narratives link the company’s broader story, such as its business direction, risks, and opportunities, to a live financial forecast, then show you what that means for a fair value today.
With Narratives, which are easy to use on Simply Wall St’s Community page, investors can build, share, and compare perspectives in seconds alongside millions of others globally. This tool helps you figure out whether to buy, sell, or hold by directly comparing your fair value estimate to the current market price. Even better, Narratives update automatically whenever key news or earnings reports change the business outlook or your forecast data, making it a truly dynamic and insightful way to invest.
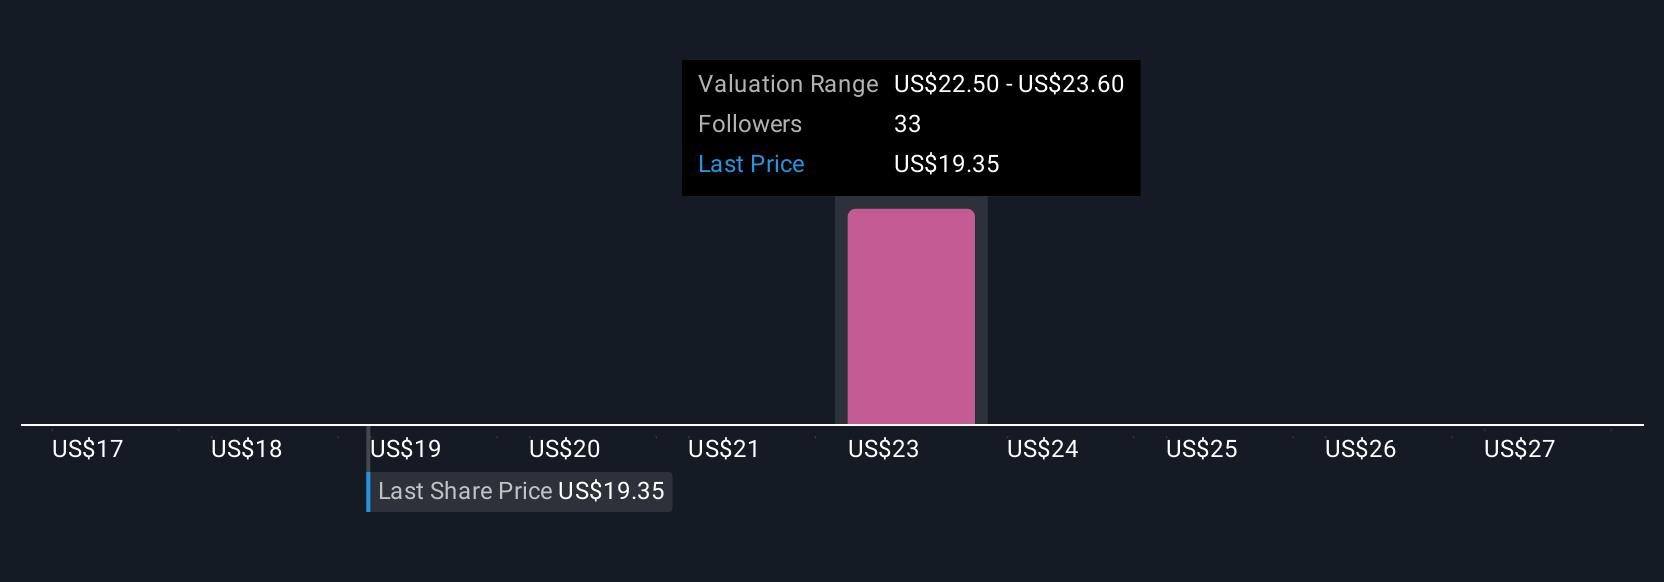
For example, some investors see Blue Owl Capital’s expansion into digital infrastructure as a major long-term growth driver and estimate a fair value as high as $29, while others focus on integration risks and set a more conservative target closer to $21. This reflects just how much the story behind the numbers can vary.
Do you think there's more to the story for Blue Owl Capital? Head over to our Community to see what others are saying!
This article by Simply Wall St is general in nature. We provide commentary based on historical data and analyst forecasts only using an unbiased methodology and our articles are not intended to be financial advice. It does not constitute a recommendation to buy or sell any stock, and does not take account of your objectives, or your financial situation. We aim to bring you long-term focused analysis driven by fundamental data. Note that our analysis may not factor in the latest price-sensitive company announcements or qualitative material. Simply Wall St has no position in any stocks mentioned.
Valuation is complex, but we're here to simplify it.
Discover if Blue Owl Capital might be undervalued or overvalued with our detailed analysis, featuring fair value estimates, potential risks, dividends, insider trades, and its financial condition.
Access Free AnalysisHave feedback on this article? Concerned about the content? Get in touch with us directly. Alternatively, email editorial-team@simplywallst.com
About NYSE:OWL
Blue Owl Capital
Operates as an alternative asset manager in the United States.
High growth potential with adequate balance sheet.
Similar Companies
Market Insights

Advertisement
Community Narratives
The company that turned a verb into a global necessity and basically runs the modern internet, digital ads, smartphones, maps, and AI.
Fair Value US$300.00|7.1% undervalued
OS
Community Contributor
Flowers Foods Pays A Fair Price For Health
Fair Value US$16.12|26.4% undervalued
NV
Community Contributor
TMX Group will thrive with 33.3% profit margin and enduring market moat
Fair Value CA$49.90|0.8% overvalued
LI
Community Contributor
The "Molecular Pencil": Why Beam's Technology is Built to Win
Fair Value US$65.01|65.8% undervalued
DA
Community Contributor