Advertisement
- United States
- /
- Capital Markets
- /
- NYSE:JEF
Jefferies Financial Group (JEF): Valuation in Focus Following Receivables Investigation Linked to First Brands Bankruptcy

Simply Wall St
Reviewed by Simply Wall St
Jefferies Financial Group (JEF) shares moved after Bragar Eagel & Squire, P.C. announced an investigation into the company’s handling of receivables tied to the bankruptcy of First Brands. This development raises new legal and financial questions for investors.
See our latest analysis for Jefferies Financial Group.
This legal uncertainty has added to an already volatile year for Jefferies, following several routine bond offerings and a sharp drop in share price. The latest 1-day share price return of 2.21% reflects a quick rebound, but with a year-to-date price return of -31.02%, momentum has clearly faded. Still, looking at the bigger picture, long-term shareholders have enjoyed a 182.6% total return over five years.
If news-driven volatility has you looking for what else the market has to offer, it might be the perfect moment to expand your search and discover fast growing stocks with high insider ownership
With Jefferies trading more than 20% below the average analyst price target and showing signs of long-term strength, the key question becomes whether the recent uncertainties have created a genuine buying opportunity or if the market is already pricing in all foreseeable risks and growth.
Price-to-Earnings of 17.5x: Is it justified?
Jefferies currently trades at a price-to-earnings (P/E) ratio of 17.5x, just slightly above its estimated fair P/E ratio of 17.4x. At $54.51 per share, this places Jefferies' valuation roughly in line with what analysts and financial models might expect based on current earnings power.
The P/E ratio measures what investors are willing to pay today for a dollar of earnings in the future. In the financial sector, especially for capital markets firms, this metric highlights how the market prices growth prospects, risk appetite, and profitability compared to industry and peer averages.
Jefferies’ P/E ratio is below both the industry average of 24.1x and the broader U.S. market average of 18x but just above its estimated fair value. This suggests the market is not pricing in aggressive growth or premium profitability. Instead, investors may be weighing recent earnings improvements against lingering volatility and sector-specific risks. The fair ratio of 17.4x indicates Jefferies is valued at a level the market could reasonably move towards if current trends continue.
Explore the SWS fair ratio for Jefferies Financial Group
Result: Price-to-Earnings of 17.5x (ABOUT RIGHT)
However, ongoing legal uncertainties and the company’s recent share price volatility could quickly shift investor sentiment. This may challenge the sustainability of Jefferies’ current valuation.
Find out about the key risks to this Jefferies Financial Group narrative.
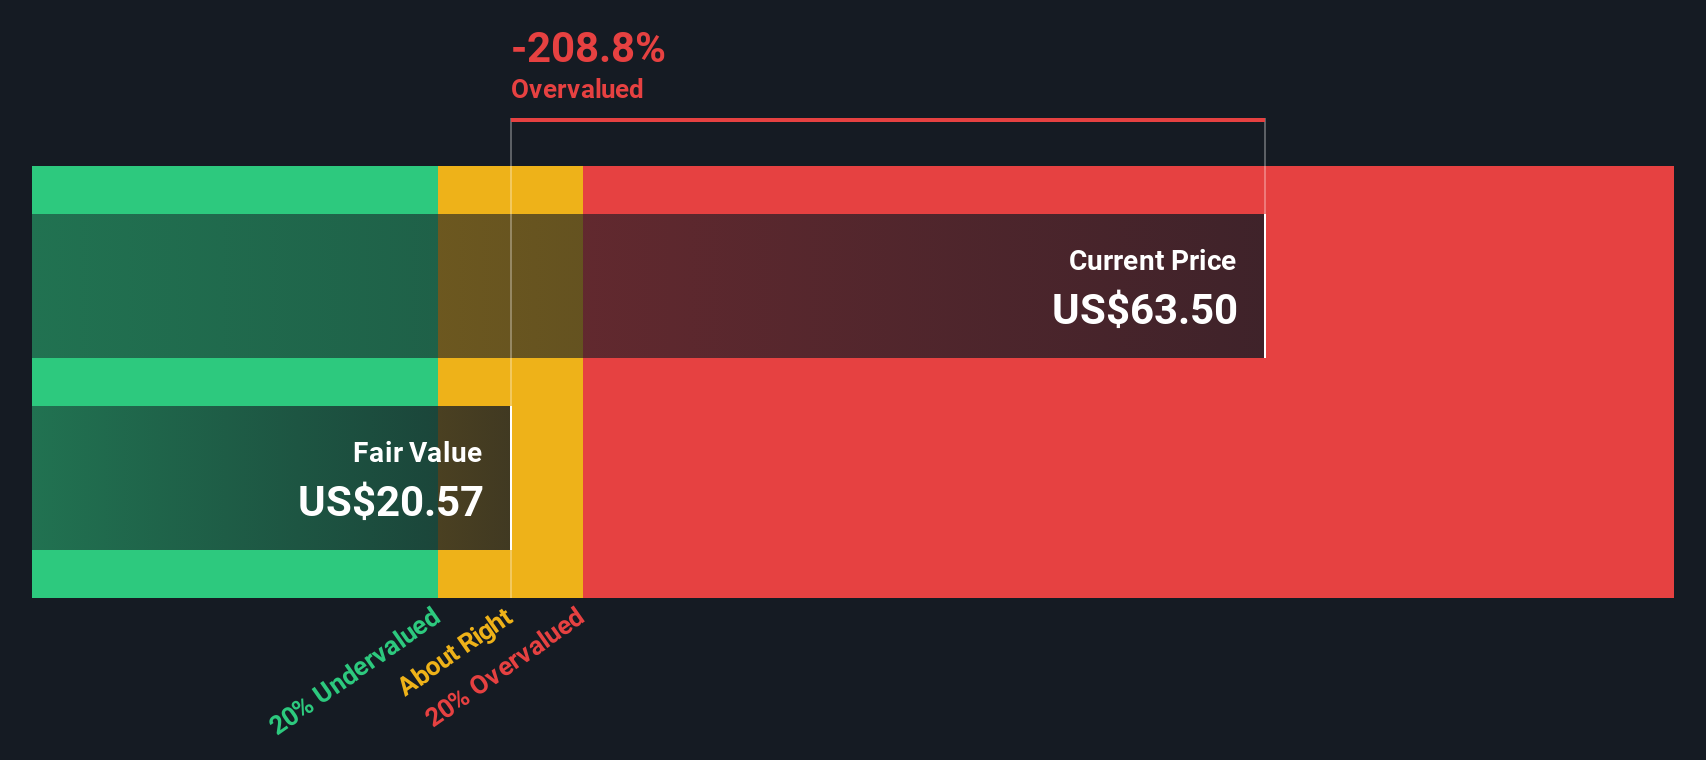
Another View: Discounted Cash Flow Paints a Different Picture
While the P/E ratio hints that Jefferies is roughly fairly valued, our DCF model tells another story. According to this approach, Jefferies’ current share price sits well above its estimated fair value. This signals that the stock could be overvalued if future cash flows do not meet high expectations. Could this gap highlight hidden risks, or are traditional models overlooking something crucial?
Look into how the SWS DCF model arrives at its fair value.
Simply Wall St performs a discounted cash flow (DCF) on every stock in the world every day (check out Jefferies Financial Group for example). We show the entire calculation in full. You can track the result in your watchlist or portfolio and be alerted when this changes, or use our stock screener to discover 870 undervalued stocks based on their cash flows. If you save a screener we even alert you when new companies match - so you never miss a potential opportunity.
Build Your Own Jefferies Financial Group Narrative
Consider digging into the details yourself and crafting your own story. It takes just a few moments to build a unique perspective. Do it your way
A great starting point for your Jefferies Financial Group research is our analysis highlighting 3 key rewards and 1 important warning sign that could impact your investment decision.
Looking for more investment ideas?
If you want an edge in today's market, check out these fresh angles with the Simply Wall St Screener. The right stock could be just a click away.
- Capitalize on the AI boom and invest alongside pioneering companies by starting with these 24 AI penny stocks right now.
- Unlock market potential and spot undervalued plays for tomorrow’s gains using these 870 undervalued stocks based on cash flows today.
- Target steady income and shield your portfolio with these 16 dividend stocks with yields > 3% offering yields above 3%.
This article by Simply Wall St is general in nature. We provide commentary based on historical data and analyst forecasts only using an unbiased methodology and our articles are not intended to be financial advice. It does not constitute a recommendation to buy or sell any stock, and does not take account of your objectives, or your financial situation. We aim to bring you long-term focused analysis driven by fundamental data. Note that our analysis may not factor in the latest price-sensitive company announcements or qualitative material. Simply Wall St has no position in any stocks mentioned.
New: Manage All Your Stock Portfolios in One Place
We've created the ultimate portfolio companion for stock investors, and it's free.
• Connect an unlimited number of Portfolios and see your total in one currency
• Be alerted to new Warning Signs or Risks via email or mobile
• Track the Fair Value of your stocks
Have feedback on this article? Concerned about the content? Get in touch with us directly. Alternatively, email editorial-team@simplywallst.com
About NYSE:JEF
Jefferies Financial Group
Operates as an investment banking and capital markets firm in the Americas, Europe, the Middle East, and the Asia-Pacific.
Proven track record average dividend payer.
Similar Companies
Market Insights

Advertisement
Community Narratives
The company that turned a verb into a global necessity and basically runs the modern internet, digital ads, smartphones, maps, and AI.
Fair Value US$300.00|7.1% undervalued
OS
Community Contributor
Flowers Foods Pays A Fair Price For Health
Fair Value US$16.12|26.4% undervalued
NV
Community Contributor
TMX Group will thrive with 33.3% profit margin and enduring market moat
Fair Value CA$49.90|0.8% overvalued
LI
Community Contributor
The "Molecular Pencil": Why Beam's Technology is Built to Win
Fair Value US$65.01|65.8% undervalued
DA
Community Contributor