Advertisement
- United States
- /
- Mortgage REITs
- /
- NYSE:DX
Dynex Capital (DX): Exploring Valuation After Strong 26% Shareholder Return Over 12 Months

Simply Wall St
Reviewed by Simply Wall St
Dynex Capital (DX) has been catching the eye of income-focused investors recently, particularly with its steady dividend profile and the company’s performance over the past year. Shares have climbed 26% in the past 12 months, reflecting renewed interest in the mortgage REIT sector.
See our latest analysis for Dynex Capital.
Dynex Capital's share price has steadily advanced over the past year, with most of that momentum coming in the last several months as investors warmed to the sector. While the 26% total shareholder return highlights long-term strength, recent price movement suggests confidence is holding up even as the broader market looks for clear direction.
If this kind of momentum has you interested in what else is out there, now is the perfect time to discover fast growing stocks with high insider ownership
But with shares now hovering close to analyst price targets and robust returns already delivered, should investors view Dynex Capital as undervalued? Or has the market already priced in all that future growth potential?
Price-to-Earnings of 11.2x: Is it justified?
Dynex Capital currently trades at a price-to-earnings (P/E) ratio of 11.2x, noticeably lower than both its direct peers and the broader US market. With the last close price at $13.41, the market appears to be putting a discount on the company’s future earnings compared to competitors.
The price-to-earnings ratio measures what investors are willing to pay for each dollar of annual earnings. For Mortgage REITs like Dynex Capital, this metric is an essential lens for examining relative value, due to the sector’s earnings-driven nature and dividend focus.
At 11.2x earnings, Dynex Capital is trading at a more attractive level than the US Mortgage REITs industry average (12.2x) and the peer average (13.2x). Compared to the estimated fair price-to-earnings ratio of 16.5x, the stock’s current valuation suggests that the market may be underestimating its earnings potential, or alternatively, is factoring in more downside risk than the fundamentals suggest. If the market shifts expectations, there could be room for the valuation multiple to move closer to this fair ratio.
Explore the SWS fair ratio for Dynex Capital
Result: Price-to-Earnings of 11.2x (UNDERVALUED)
However, potential risks remain, such as unpredictable revenue growth or sector volatility. These factors could quickly reverse recent gains and change investor sentiment.
Find out about the key risks to this Dynex Capital narrative.
Another View: What Does the SWS DCF Model Say?
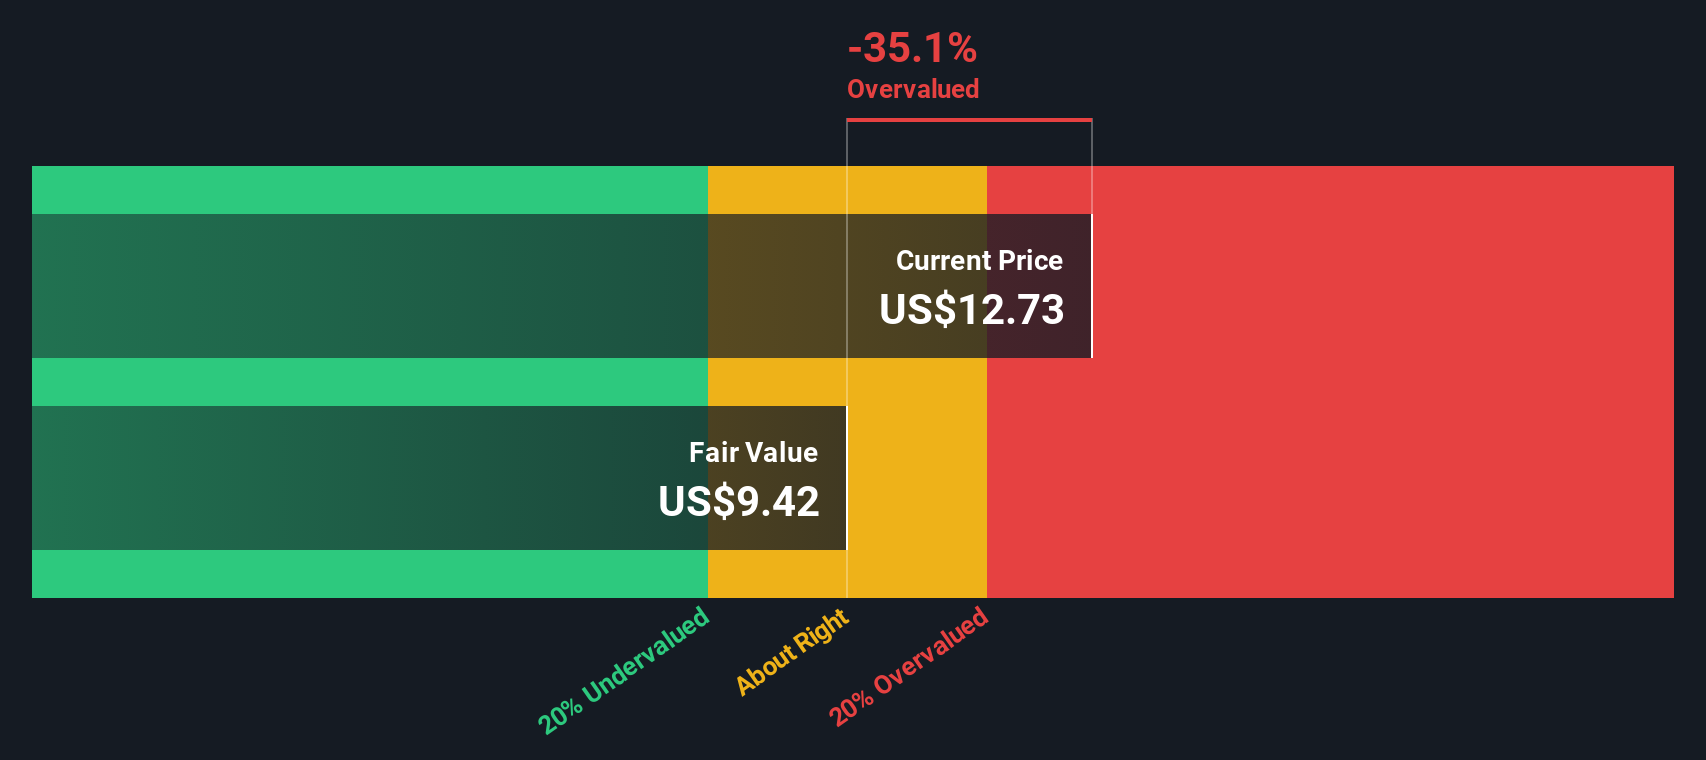
While the earnings-based valuation suggests Dynex Capital looks undervalued compared to peers, the SWS DCF model tells a different story. According to our DCF estimate, shares currently trade well above their fair value of $8.63, which could indicate that the market is overly optimistic about future cash flows. Which perspective will prove more accurate as the year unfolds?
Look into how the SWS DCF model arrives at its fair value.
Simply Wall St performs a discounted cash flow (DCF) on every stock in the world every day (check out Dynex Capital for example). We show the entire calculation in full. You can track the result in your watchlist or portfolio and be alerted when this changes, or use our stock screener to discover 908 undervalued stocks based on their cash flows. If you save a screener we even alert you when new companies match - so you never miss a potential opportunity.
Build Your Own Dynex Capital Narrative
If this analysis does not fully match your perspective, why not dive into the numbers yourself and develop your own view in just a few minutes with Do it your way
A great starting point for your Dynex Capital research is our analysis highlighting 4 key rewards and 3 important warning signs that could impact your investment decision.
Looking for more investment ideas?
Smart investors never stop searching for tomorrow’s opportunities. Find potential game-changers and stay ahead of the crowd with these handpicked investing themes on Simply Wall St.
- Unlock reliable income streams by checking out these 15 dividend stocks with yields > 3%, offering attractive yields above 3% and solid fundamentals for steady long-term growth.
- Get ahead of digital disruption when you analyze these 26 AI penny stocks, leading innovation in artificial intelligence and automating tomorrow’s industries today.
- Accelerate your portfolio’s growth potential by reviewing these 908 undervalued stocks based on cash flows, packed with strong cash flow yet trading at bargain prices.
This article by Simply Wall St is general in nature. We provide commentary based on historical data and analyst forecasts only using an unbiased methodology and our articles are not intended to be financial advice. It does not constitute a recommendation to buy or sell any stock, and does not take account of your objectives, or your financial situation. We aim to bring you long-term focused analysis driven by fundamental data. Note that our analysis may not factor in the latest price-sensitive company announcements or qualitative material. Simply Wall St has no position in any stocks mentioned.
New: Manage All Your Stock Portfolios in One Place
We've created the ultimate portfolio companion for stock investors, and it's free.
• Connect an unlimited number of Portfolios and see your total in one currency
• Be alerted to new Warning Signs or Risks via email or mobile
• Track the Fair Value of your stocks
Have feedback on this article? Concerned about the content? Get in touch with us directly. Alternatively, email editorial-team@simplywallst.com
About NYSE:DX
Dynex Capital
A mortgage real estate investment trust, invests in mortgage-backed securities (MBS) in the United States.
High growth potential with proven track record.
Similar Companies
Market Insights

Advertisement
Community Narratives
MicroVision will explode future revenue by 380.37% with a vision towards success
Fair Value US$60.00|98.5% undervalued
TH
Community Contributor
The Indispensable Artery for a New North American Economy
Fair Value CA$132.87|2.3% undervalued
TI
Community Contributor