Advertisement
- United States
- /
- Capital Markets
- /
- NasdaqGS:TROW
T. Rowe Price (TROW) Earnings Rebound Challenges Bearish Narrative as Margins Stabilize

Simply Wall St
Reviewed by Simply Wall St
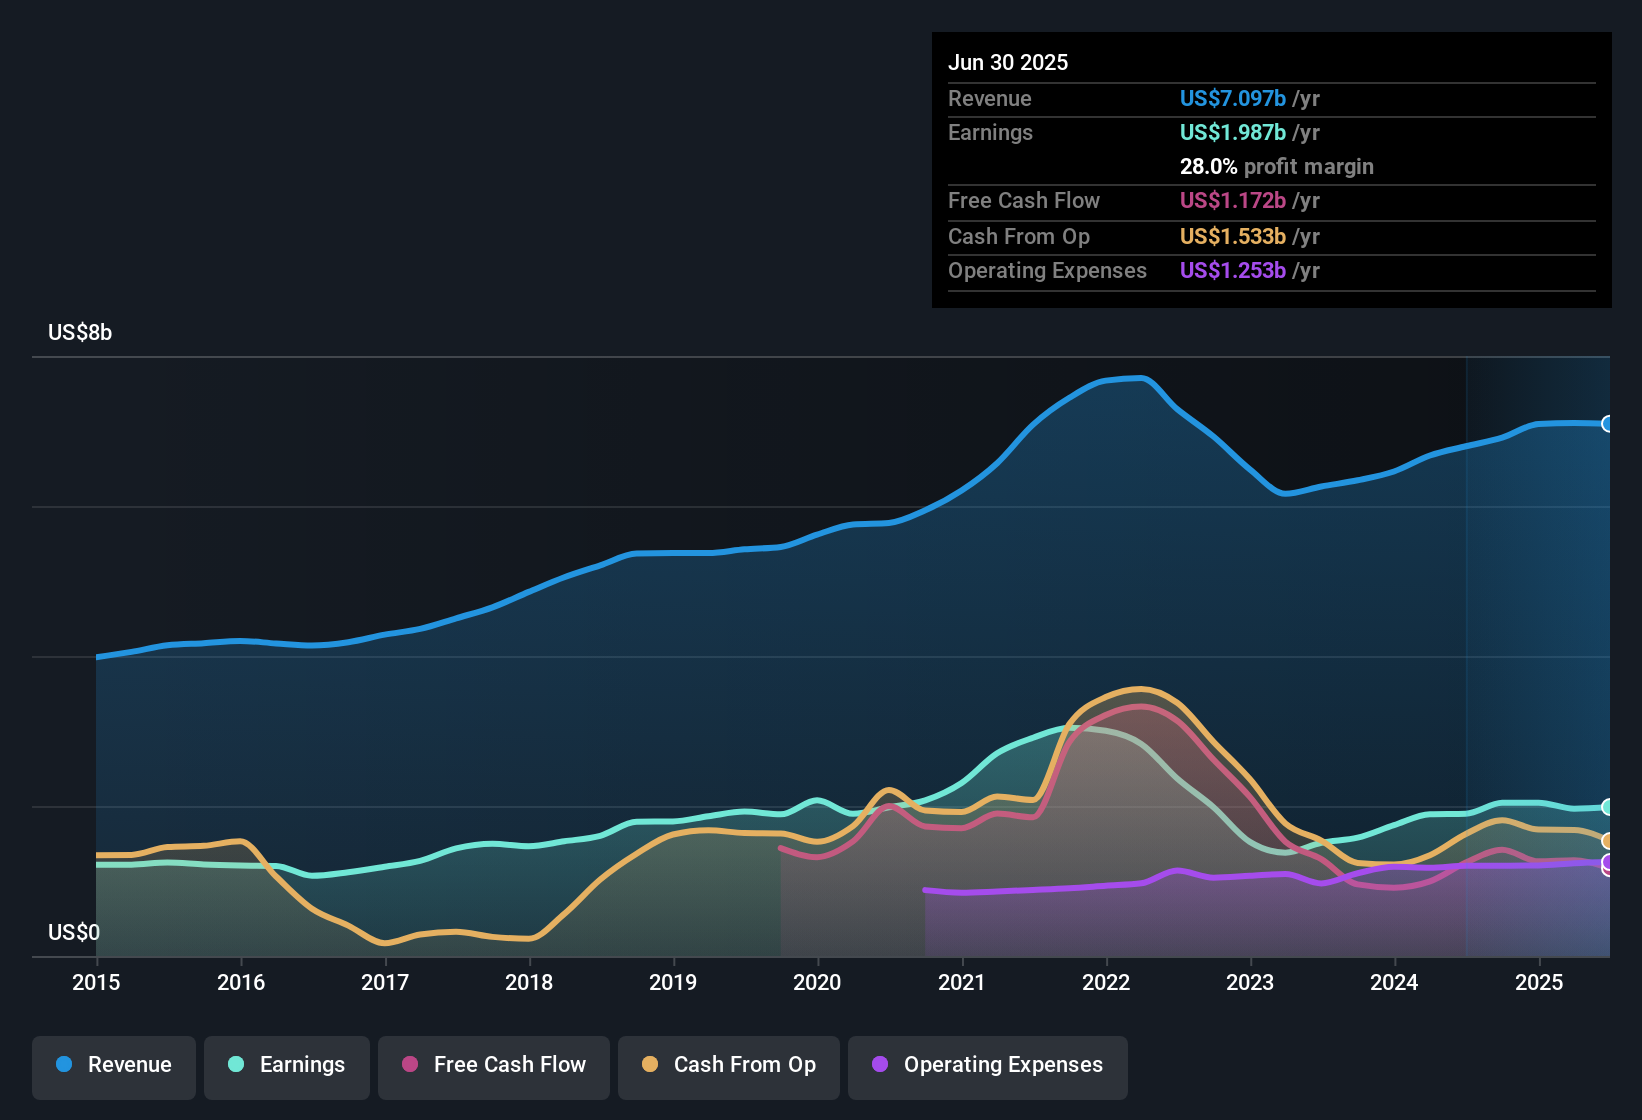
T. Rowe Price Group (TROW) posted a 4.7% increase in earnings over the past year, reversing the average annual decline of 9.1% seen over the prior five years. The company's net profit margin inched up to 28% from last year’s 27.9%. Looking ahead, earnings are projected to grow at 8.9% per year, trailing the broader US market's 15.9% forecasted rate. Investors are weighing TROW’s attractive valuation, strong relative value, and stable margins against concerns about dividend sustainability.
See our full analysis for T. Rowe Price Group.Next up, we’ll see how these headline numbers compare with the prevailing market narratives. This will highlight where the data affirms the consensus and where it raises new questions.
See what the community is saying about T. Rowe Price Group
Margin Outlook: Analysts Project a Climb to 30.6%
- Analysts estimate that T. Rowe Price's net profit margin, currently at 28%, will rise to 30.6% over the next three years, highlighting expectations for improved operational efficiency.
- According to the analysts' consensus view, technology investments and disciplined expense management are expected to be key drivers for this margin expansion.
- Planned initiatives, such as streamlining processes, digital platforms, and AI adoption, are projected to reduce operating expenses, directly supporting higher future margins.
- The consensus narrative also connects these margin improvements to the firm’s ability to maintain earnings growth even amid industry-wide fee pressures.
Curious how analysts are connecting margin gains to T. Rowe Price’s growth story? 📊 Read the full T. Rowe Price Group Consensus Narrative.
ETF Expansion and Global Growth Fuel Asset Base
- The consensus narrative emphasizes that new ETF launches and global partnerships are actively expanding T. Rowe Price's client base and assets under management, with innovation in retirement solutions further accelerating inflows.
- Analysts' consensus view highlights how this expansion is not just broadening the firm's reach but helping offset headwinds from the shift toward passive investment strategies and market share loss in legacy products.
- Notably, enhanced Target Date fund offerings and increased international mandates, especially from regions like Japan and Switzerland, are cited as major contributors to anticipated topline growth.
- Despite persistent net outflows in certain U.S. equity segments, diversification into ETFs and private market alternatives is seen as stabilizing long-term revenue streams.
Valuation Advantage: PE Ratio Sits Below Peers
- T. Rowe Price’s price-to-earnings ratio stands at just 11.3x, well below the US Capital Markets industry average of 25.6x and its peer group’s 21.2x, creating a sizeable discount against comparable firms.
- The analysts' consensus view finds that with shares trading at $102.53 versus a DCF fair value of $168.35 and an analyst price target of $108.69, the current valuation is compelling for investors who believe the projected $2.3 billion in 2028 earnings and margin growth are achievable.
- The tight gap between today’s share price and the analyst price target suggests market participants see T. Rowe Price as fairly priced, but with meaningful upside if its margin expansion and revenue growth materialize.
- The consensus narrative reinforces that sentiment is supported by relative undervaluation and quality earnings, though debate remains on the pace of long-term growth.
Next Steps
To see how these results tie into long-term growth, risks, and valuation, check out the full range of community narratives for T. Rowe Price Group on Simply Wall St. Add the company to your watchlist or portfolio so you'll be alerted when the story evolves.
Have your own take on the numbers? It only takes a few minutes to shape your perspective into a fresh narrative. Do it your way.
A great starting point for your T. Rowe Price Group research is our analysis highlighting 3 key rewards and 1 important warning sign that could impact your investment decision.
See What Else Is Out There
T. Rowe Price’s growth outlook and margins remain solid, but competitive pressure and persistent outflows from certain segments are clouding future revenue stability.
If consistent expansion is what matters to you, check out stable growth stocks screener (2103 results) to find companies with a track record of steady growth regardless of market conditions.
This article by Simply Wall St is general in nature. We provide commentary based on historical data and analyst forecasts only using an unbiased methodology and our articles are not intended to be financial advice. It does not constitute a recommendation to buy or sell any stock, and does not take account of your objectives, or your financial situation. We aim to bring you long-term focused analysis driven by fundamental data. Note that our analysis may not factor in the latest price-sensitive company announcements or qualitative material. Simply Wall St has no position in any stocks mentioned.
Valuation is complex, but we're here to simplify it.
Discover if T. Rowe Price Group might be undervalued or overvalued with our detailed analysis, featuring fair value estimates, potential risks, dividends, insider trades, and its financial condition.
Access Free AnalysisHave feedback on this article? Concerned about the content? Get in touch with us directly. Alternatively, email editorial-team@simplywallst.com
About NasdaqGS:TROW
Undervalued with excellent balance sheet and pays a dividend.
Similar Companies
Market Insights

Advertisement
Community Narratives
The company that turned a verb into a global necessity and basically runs the modern internet, digital ads, smartphones, maps, and AI.
Fair Value US$300.00|6.3% undervalued
OS
Community Contributor
Flowers Foods Pays A Fair Price For Health
Fair Value US$16.12|26.0% undervalued
NV
Community Contributor
TMX Group will thrive with 33.3% profit margin and enduring market moat
Fair Value CA$49.90|3.7% overvalued
LI
Community Contributor