Advertisement
- United States
- /
- Capital Markets
- /
- NasdaqGS:SNEX
StoneX Group (SNEX): Exploring Current Valuation After Recent Period of Consistent Performance

Simply Wall St
Reviewed by Simply Wall St
StoneX Group (SNEX) has seen its stock hold steady recently, with only modest changes over the past week and month. Investors may be considering its longer-term performance and consistent profitability as they evaluate the next move.
See our latest analysis for StoneX Group.
StoneX Group’s share price is still up nearly 29% for the year to date despite a recent pullback, and the 1-year total shareholder return sits at an impressive 33%. While momentum has cooled after delivering a remarkable 229% total return over five years, the longer-term trend continues to highlight the company’s growth potential and resilience.
If you’re watching how leaders like StoneX perform, this could be an ideal moment to broaden your search and uncover opportunities with fast growing stocks with high insider ownership.
With StoneX shares trading below analyst price targets and boasting strong long-term gains, the question for investors is clear: Is there still hidden value in the stock, or has the market already priced in StoneX’s future growth?
Price-to-Earnings of 15.6x: Is it justified?
StoneX Group trades at a price-to-earnings ratio of 15.6x, which is higher than its peer group average of 8.1x and slightly above the estimated fair ratio of 15.5x. At the last close of $86.07, this valuation signals the market is pricing in premium expectations versus competitors.
The price-to-earnings multiple (P/E) measures how much investors are paying per dollar of earnings and helps gauge whether a stock is expensive or cheap relative to its profitability. For StoneX, a higher P/E could indicate investors anticipate stronger profit growth or greater consistency compared to other companies in its peer group.
Compared to the US Capital Markets industry’s average P/E of 23.8x, StoneX actually appears attractively valued, despite being pricier than its direct peers. The market’s view, as reflected in the estimated fair ratio, suggests StoneX’s current premium could be sustainable if it delivers on earnings growth. However, if market dynamics shift towards the fair ratio, some valuation pressure may emerge.
Explore the SWS fair ratio for StoneX Group
Result: Price-to-Earnings of 15.6x (OVERVALUED)
However, shifts in broader capital markets sentiment or a slowdown in earnings growth could quickly challenge the optimistic outlook for StoneX shares.
Find out about the key risks to this StoneX Group narrative.
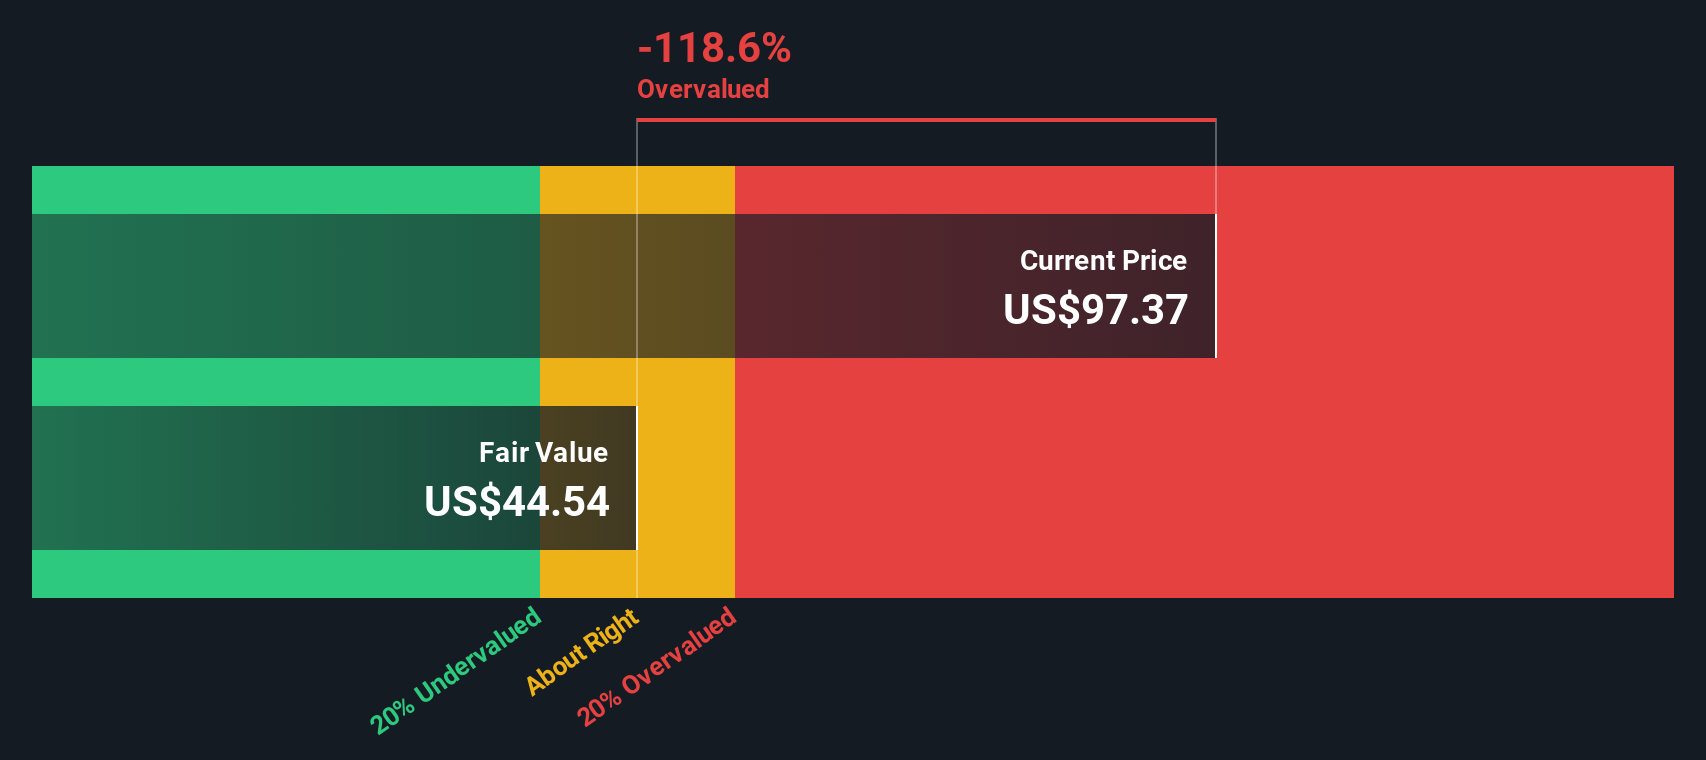
Another View: Discounted Cash Flow Points Lower
Switching gears to our SWS DCF model, the outlook on StoneX Group takes a different turn. While market multiples point to optimism, the DCF model suggests the stock is currently overvalued and trading above its estimated fair value of $43.93. Does this method reveal risks that the market is missing, or is it too conservative given StoneX’s track record?
Look into how the SWS DCF model arrives at its fair value.
Simply Wall St performs a discounted cash flow (DCF) on every stock in the world every day (check out StoneX Group for example). We show the entire calculation in full. You can track the result in your watchlist or portfolio and be alerted when this changes, or use our stock screener to discover 861 undervalued stocks based on their cash flows. If you save a screener we even alert you when new companies match - so you never miss a potential opportunity.
Build Your Own StoneX Group Narrative
If you want to explore the numbers for yourself or draw your own conclusions, you can easily start building your own perspective in just minutes. Do it your way
A great starting point for your StoneX Group research is our analysis highlighting 3 key rewards and 1 important warning sign that could impact your investment decision.
Looking for More Investment Opportunities?
Smart investors know the value of casting a wide net. Don’t limit yourself; new trends, technologies, and growth stories are waiting for your attention, and you could be missing out on the next big winner. Use these focused screeners to enhance your search and stay ahead of the curve:
- Capitalize on the surge in medical technology by checking out these 32 healthcare AI stocks powering transformations across healthcare and diagnostics.
- Secure your portfolio’s future potential by spotting these 861 undervalued stocks based on cash flows that market participants have overlooked yet still offer compelling upside.
- Tap into high-income opportunities and stability with these 17 dividend stocks with yields > 3% delivering strong yields in today’s evolving market.
This article by Simply Wall St is general in nature. We provide commentary based on historical data and analyst forecasts only using an unbiased methodology and our articles are not intended to be financial advice. It does not constitute a recommendation to buy or sell any stock, and does not take account of your objectives, or your financial situation. We aim to bring you long-term focused analysis driven by fundamental data. Note that our analysis may not factor in the latest price-sensitive company announcements or qualitative material. Simply Wall St has no position in any stocks mentioned.
New: Manage All Your Stock Portfolios in One Place
We've created the ultimate portfolio companion for stock investors, and it's free.
• Connect an unlimited number of Portfolios and see your total in one currency
• Be alerted to new Warning Signs or Risks via email or mobile
• Track the Fair Value of your stocks
Have feedback on this article? Concerned about the content? Get in touch with us directly. Alternatively, email editorial-team@simplywallst.com
About NasdaqGS:SNEX
StoneX Group
Operates as a global financial services network that connects companies, organizations, traders, and investors to market ecosystem in the United States, Europe, South America, the Middle East, Asia, and internationally.
Proven track record with adequate balance sheet.
Similar Companies
Market Insights

Advertisement
Community Narratives
The company that turned a verb into a global necessity and basically runs the modern internet, digital ads, smartphones, maps, and AI.
Fair Value US$300.00|5.1% undervalued
OS
Community Contributor
Flowers Foods Pays A Fair Price For Health
Fair Value US$16.12|27.7% undervalued
NV
Community Contributor
TMX Group will thrive with 33.3% profit margin and enduring market moat
Fair Value CA$49.90|0.2% overvalued
LI
Community Contributor
The "Molecular Pencil": Why Beam's Technology is Built to Win
Fair Value US$65.01|64.4% undervalued
DA
Community Contributor