Advertisement
- United States
- /
- Diversified Financial
- /
- NasdaqGS:FISV
Is Fiserv Now an Opportunity After a 70% Slide in 2025?

Simply Wall St
Reviewed by Bailey Pemberton
- Wondering if Fiserv is a golden opportunity or a value trap? You are not alone, as many investors are asking the same question with its price shifts catching attention.
- Fiserv's shares recently dipped slightly by 0.3% this week, but the stock has seen a dramatic drop of 47.6% over the past month and is now down 70.0% in the past year. This could signal changing perceptions of growth or risk.
- Market confidence in Fiserv has been shaped by sector-wide fintech turbulence and regulatory headlines that have rattled payment providers across the board. Recent discussions in financial media also point to increased competition and industry disruption as factors weighing on the share price.
- Currently, Fiserv scores 5 out of 6 on our undervaluation checks, which puts it firmly on the radar for value-focused investors. Soon, we will dive into the standard valuation approaches as well as a better way to size up whether Fiserv is really as undervalued as it looks.
Find out why Fiserv's -70.0% return over the last year is lagging behind its peers.
Approach 1: Fiserv Excess Returns Analysis
The Excess Returns Model evaluates whether a company generates profits that exceed the required return for its investors, based on its equity and earnings power. This approach focuses on the efficiency and profitability of Fiserv's core business by looking at what shareholders actually receive above the minimum return needed to attract investment.
For Fiserv, the analysis shows:
- Book Value: $46.78 per share
- Stable EPS: $9.78 per share
(Source: Weighted future Return on Equity estimates from 8 analysts.) - Cost of Equity: $5.26 per share
- Excess Return: $4.52 per share
- Average Return on Equity: 17.00%
- Stable Book Value: $57.53 per share
(Source: Weighted future Book Value estimates from 4 analysts.)
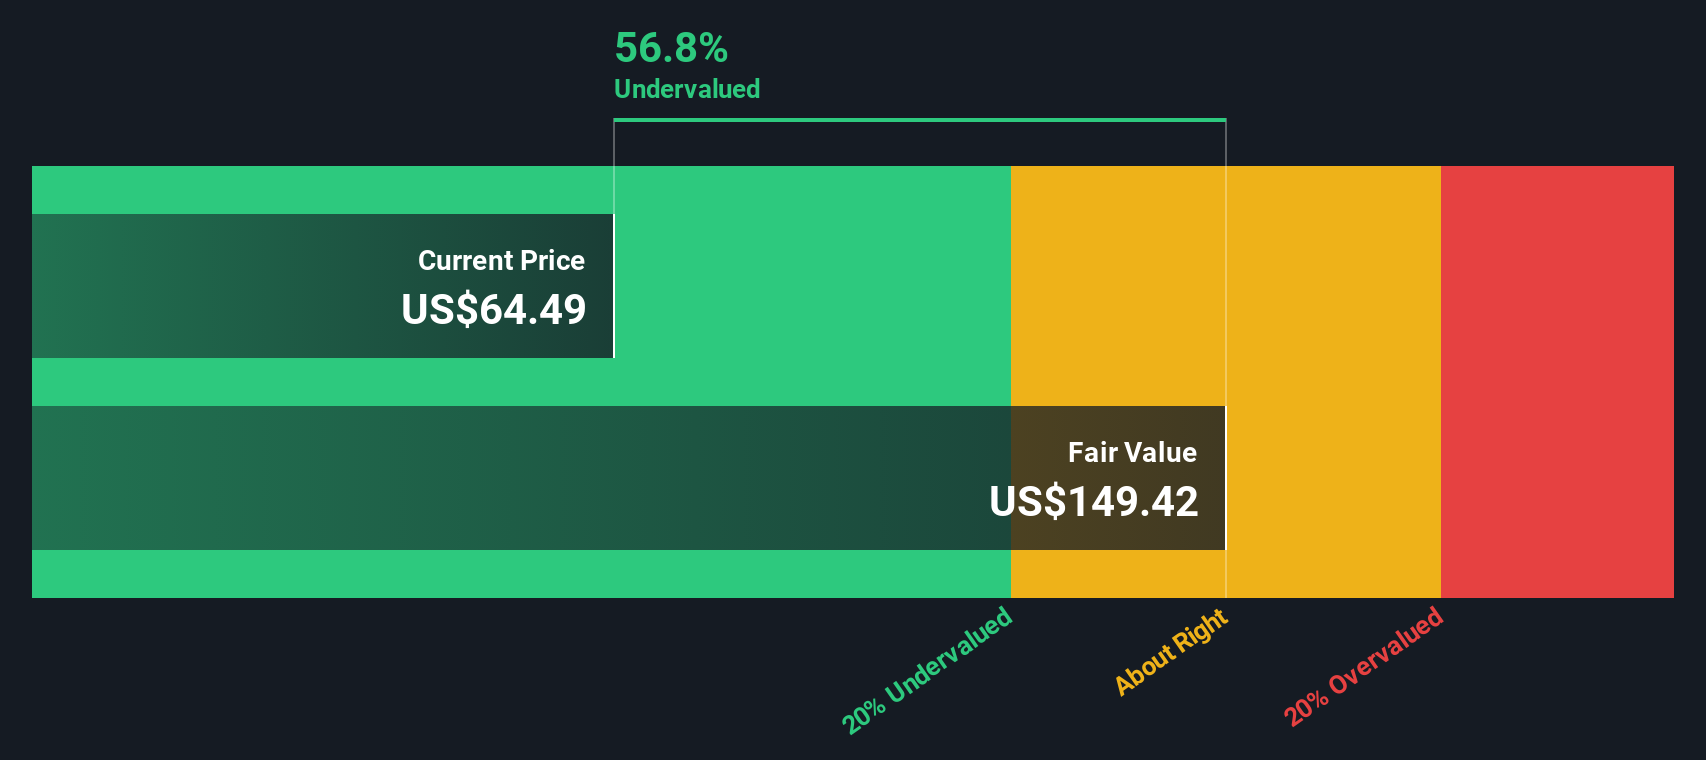
This model places a fair value estimate on Fiserv’s share price of $134.52. Since the current share price is trading at a 52.2% discount to this value, the Excess Returns analysis suggests the market is significantly undervaluing Fiserv's ability to generate returns in excess of its cost of capital.
Result: UNDERVALUED
Our Excess Returns analysis suggests Fiserv is undervalued by 52.2%. Track this in your watchlist or portfolio, or discover 855 more undervalued stocks based on cash flows.
Approach 2: Fiserv Price vs Earnings
The price-to-earnings (PE) ratio is a popular way to value profitable companies like Fiserv because it directly relates the stock price to the company’s earnings, making it easier to compare across businesses and industries. For companies steadily generating profits, the PE ratio provides a snapshot of how much investors are willing to pay for each dollar of earnings.
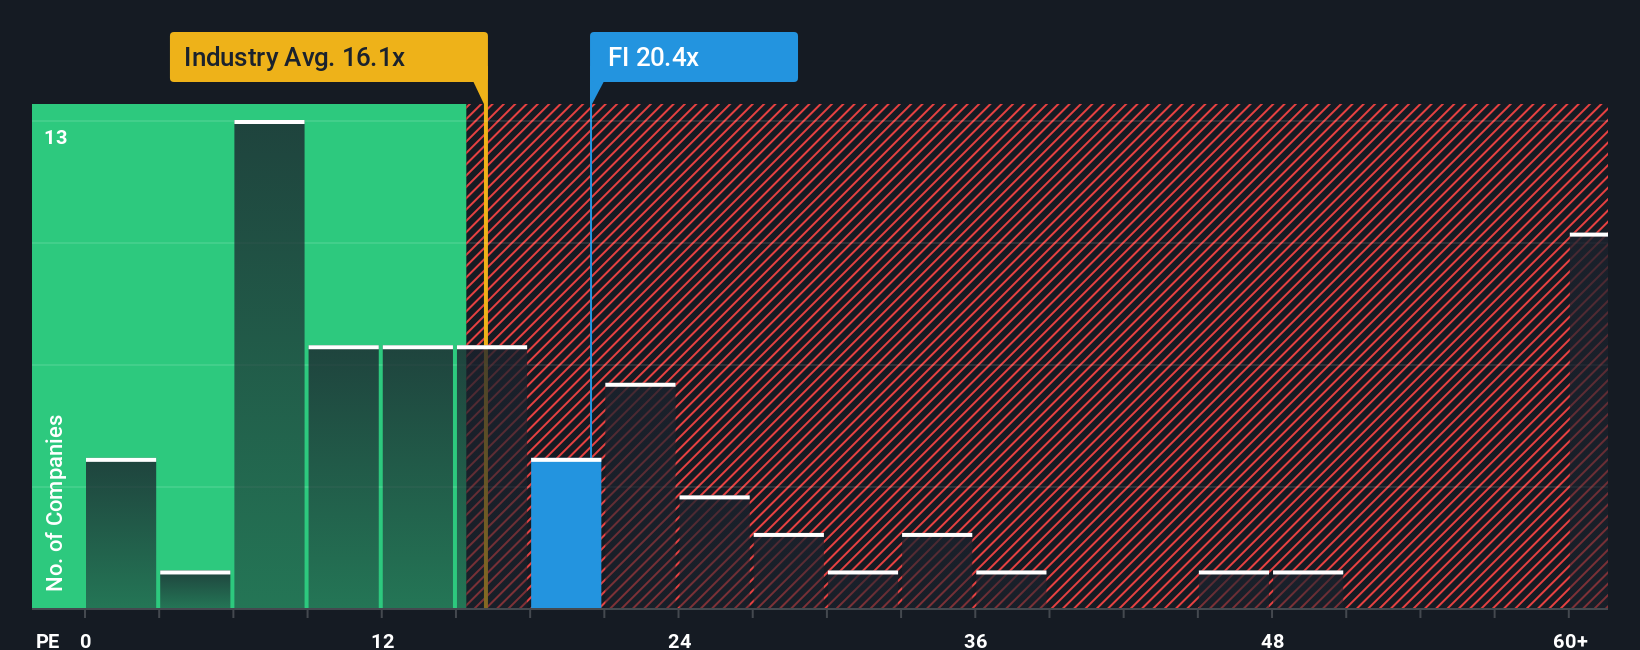
Growth expectations and perceived risk play a big role in what counts as a “normal” or “fair” PE ratio. Companies expected to deliver higher growth typically deserve a higher PE, while those seen as riskier or slower-growing tend to trade on lower ones. For Fiserv, the current PE ratio stands at 9.58x, which is notably below the Diversified Financial industry average of 13.51x and far below the peer average of 59.79x. This suggests that, on a surface level, Fiserv appears cheaper than its typical industry peer.
However, Simple Wall St's proprietary Fair Ratio tells a more nuanced story. This metric, at 18.10x for Fiserv, adjusts for everything the raw numbers miss, including the company’s expected earnings growth, profit margins, market cap, industry specifics and risk factors. Unlike a simple comparison to the industry or peers, which might overlook company-specific strengths or weaknesses, the Fair Ratio gives a clearer sense of what multiple the market should be assigning to Fiserv today.
Comparing Fiserv’s actual PE of 9.58x to its Fair Ratio of 18.10x, the stock looks substantially undervalued based on this multiple approach.
Result: UNDERVALUED
PE ratios tell one story, but what if the real opportunity lies elsewhere? Discover 1369 companies where insiders are betting big on explosive growth.
Upgrade Your Decision Making: Choose your Fiserv Narrative
Earlier we mentioned that there's an even better way to understand valuation, so let's introduce you to Narratives. A Narrative is simply your story or perspective about a company like Fiserv, tying together what you believe about its business strengths, challenges, future growth, and profit margins. Then, these beliefs are translated into key financial forecasts and an estimated fair value.
Narratives are a practical tool on Simply Wall St’s Community page, helping millions of investors articulate their view, create forecasts, and see instantly how those assumptions stack up against current market prices. By mapping each Narrative to a fair value, you can clearly see if Fiserv is trading below or above what you personally think it’s worth. This makes buy or sell decisions feel more grounded and actionable.
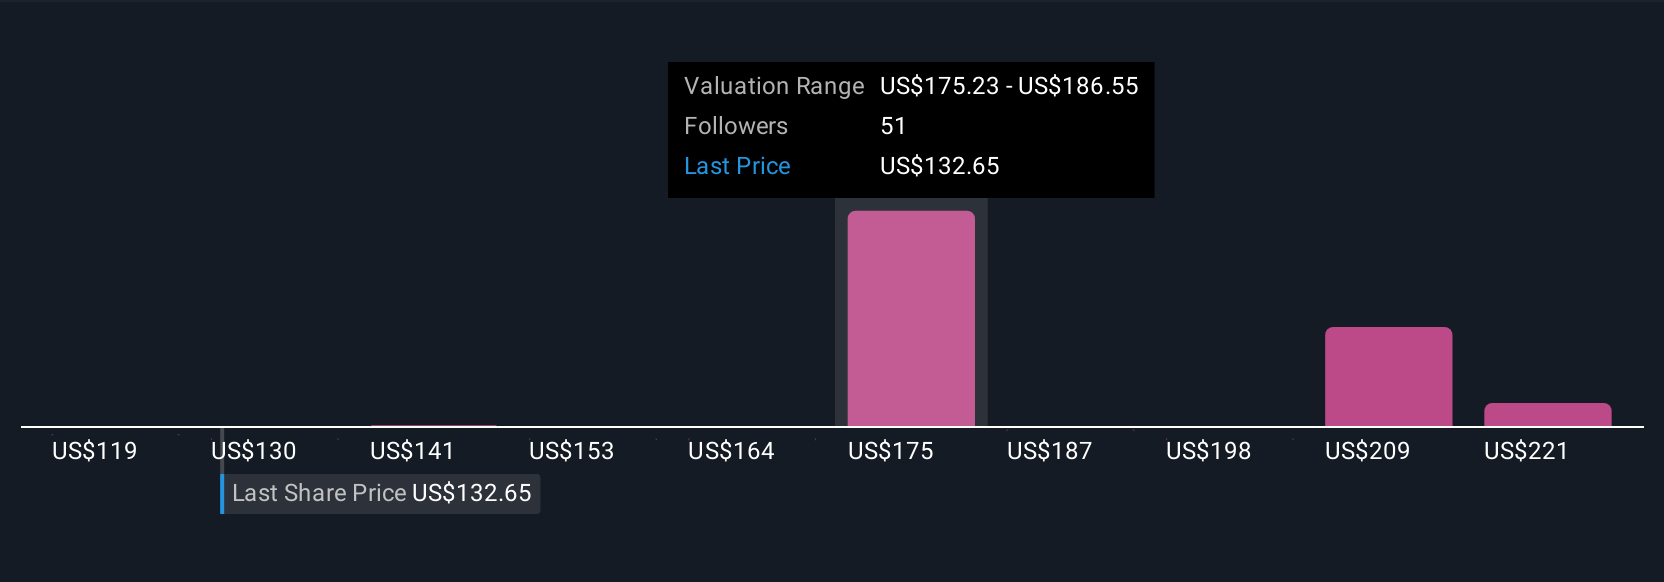
Unlike static models, Narratives update dynamically as new earnings, headlines, or events surface, so your outlook can adapt in real time. For Fiserv, one analyst Narrative might highlight rapid global digital payments growth and expansion into new segments, leading to a bullish price target of $250. Another, more cautious Narrative might focus on execution delays and margin pressures, settling on a target closer to $125. Narratives empower you to put your conviction to work, regardless of whether you’re optimistic or cautious about Fiserv’s future.
Do you think there's more to the story for Fiserv? Head over to our Community to see what others are saying!
This article by Simply Wall St is general in nature. We provide commentary based on historical data and analyst forecasts only using an unbiased methodology and our articles are not intended to be financial advice. It does not constitute a recommendation to buy or sell any stock, and does not take account of your objectives, or your financial situation. We aim to bring you long-term focused analysis driven by fundamental data. Note that our analysis may not factor in the latest price-sensitive company announcements or qualitative material. Simply Wall St has no position in any stocks mentioned.
New: AI Stock Screener & Alerts
Our new AI Stock Screener scans the market every day to uncover opportunities.
• Dividend Powerhouses (3%+ Yield)
• Undervalued Small Caps with Insider Buying
• High growth Tech and AI Companies
Or build your own from over 50 metrics.
Have feedback on this article? Concerned about the content? Get in touch with us directly. Alternatively, email editorial-team@simplywallst.com
About NasdaqGS:FISV
Fiserv
Provides payments and financial services technology solutions in the United States, Europe, the Middle East and Africa, Latin America, the Asia-Pacific, and internationally.
Undervalued with proven track record.
Similar Companies
Market Insights

Advertisement
Community Narratives
The "Molecular Pencil": Why Beam's Technology is Built to Win
Fair Value US$65.01|65.4% undervalued
DA
Community Contributor
The silent giant behind virtually every advanced chip powering AI, smartphones, and modern infrastructure.
Fair Value US$310.00|6.1% undervalued
OS
Community Contributor
ADP Stock: Solid Fundamentals, But AI Investments Test Its Margin Resilience
Fair Value US$387.77|34.2% undervalued
YI
Community Contributor
MINISO's fair value is projected at 26.69 with an anticipated PE ratio shift of 20x
Fair Value US$24.03|9.6% undervalued
BE
Community Contributor