- United States
- /
- Capital Markets
- /
- NasdaqGS:CME
CME Group (NASDAQ:CME) stock performs better than its underlying earnings growth over last three years


Investors can buy low cost index fund if they want to receive the average market return. But in any diversified portfolio of stocks, you'll see some that fall short of the average. Unfortunately for shareholders, while the CME Group Inc. (NASDAQ:CME) share price is up 10% in the last three years, that falls short of the market return. Looking at more recent returns, the stock is up 6.3% in a year.
Since it's been a strong week for CME Group shareholders, let's have a look at trend of the longer term fundamentals.
Check out our latest analysis for CME Group
There is no denying that markets are sometimes efficient, but prices do not always reflect underlying business performance. By comparing earnings per share (EPS) and share price changes over time, we can get a feel for how investor attitudes to a company have morphed over time.
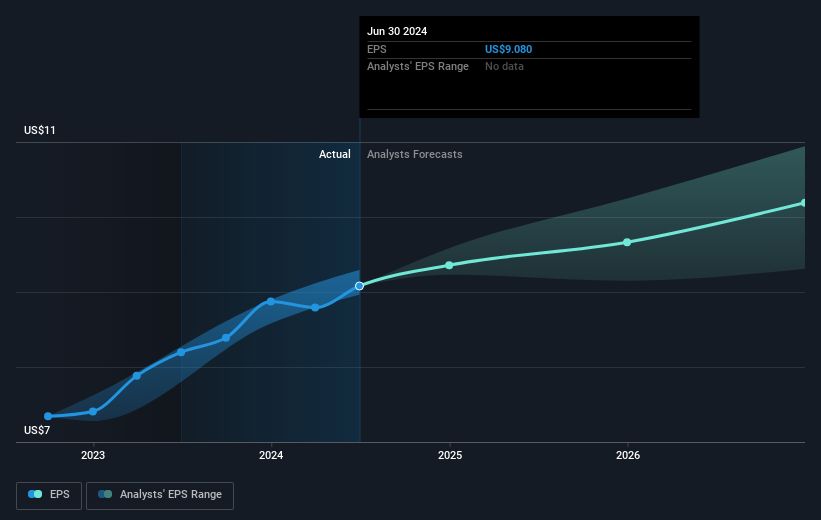
During three years of share price growth, CME Group achieved compound earnings per share growth of 19% per year. This EPS growth is higher than the 3% average annual increase in the share price. So one could reasonably conclude that the market has cooled on the stock.
The graphic below depicts how EPS has changed over time (unveil the exact values by clicking on the image).
We like that insiders have been buying shares in the last twelve months. Having said that, most people consider earnings and revenue growth trends to be a more meaningful guide to the business. It might be well worthwhile taking a look at our free report on CME Group's earnings, revenue and cash flow.
What About Dividends?
When looking at investment returns, it is important to consider the difference between total shareholder return (TSR) and share price return. The TSR is a return calculation that accounts for the value of cash dividends (assuming that any dividend received was reinvested) and the calculated value of any discounted capital raisings and spin-offs. So for companies that pay a generous dividend, the TSR is often a lot higher than the share price return. We note that for CME Group the TSR over the last 3 years was 26%, which is better than the share price return mentioned above. This is largely a result of its dividend payments!
A Different Perspective
CME Group shareholders gained a total return of 11% during the year. But that return falls short of the market. The silver lining is that the gain was actually better than the average annual return of 3% per year over five year. It is possible that returns will improve along with the business fundamentals. It's always interesting to track share price performance over the longer term. But to understand CME Group better, we need to consider many other factors. Consider risks, for instance. Every company has them, and we've spotted 1 warning sign for CME Group you should know about.
CME Group is not the only stock insiders are buying. So take a peek at this free list of small cap companies at attractive valuations which insiders have been buying.
Please note, the market returns quoted in this article reflect the market weighted average returns of stocks that currently trade on American exchanges.
New: AI Stock Screener & Alerts
Our new AI Stock Screener scans the market every day to uncover opportunities.
• Dividend Powerhouses (3%+ Yield)
• Undervalued Small Caps with Insider Buying
• High growth Tech and AI Companies
Or build your own from over 50 metrics.
Have feedback on this article? Concerned about the content? Get in touch with us directly. Alternatively, email editorial-team (at) simplywallst.com.
This article by Simply Wall St is general in nature. We provide commentary based on historical data and analyst forecasts only using an unbiased methodology and our articles are not intended to be financial advice. It does not constitute a recommendation to buy or sell any stock, and does not take account of your objectives, or your financial situation. We aim to bring you long-term focused analysis driven by fundamental data. Note that our analysis may not factor in the latest price-sensitive company announcements or qualitative material. Simply Wall St has no position in any stocks mentioned.
About NasdaqGS:CME
CME Group
Operates contract markets for the trading of futures and options on futures contracts worldwide.
Flawless balance sheet with proven track record and pays a dividend.
