Stock Analysis
- United States
- /
- Hospitality
- /
- NasdaqGS:SRAD
Is Sportradar Group AG's (NASDAQ:SRAD) Recent Price Movement Underpinned By Its Weak Fundamentals?


Sportradar Group (NASDAQ:SRAD) has had a rough month with its share price down 20%. It seems that the market might have completely ignored the positive aspects of the company's fundamentals and decided to weigh-in more on the negative aspects. Fundamentals usually dictate market outcomes so it makes sense to study the company's financials. Particularly, we will be paying attention to Sportradar Group's ROE today.
Return on equity or ROE is a key measure used to assess how efficiently a company's management is utilizing the company's capital. Simply put, it is used to assess the profitability of a company in relation to its equity capital.
See our latest analysis for Sportradar Group
How Do You Calculate Return On Equity?
The formula for return on equity is:
Return on Equity = Net Profit (from continuing operations) ÷ Shareholders' Equity
So, based on the above formula, the ROE for Sportradar Group is:
4.0% = €35m ÷ €873m (Based on the trailing twelve months to December 2023).
The 'return' is the yearly profit. One way to conceptualize this is that for each $1 of shareholders' capital it has, the company made $0.04 in profit.
What Is The Relationship Between ROE And Earnings Growth?
Thus far, we have learned that ROE measures how efficiently a company is generating its profits. Depending on how much of these profits the company reinvests or "retains", and how effectively it does so, we are then able to assess a company’s earnings growth potential. Assuming all else is equal, companies that have both a higher return on equity and higher profit retention are usually the ones that have a higher growth rate when compared to companies that don't have the same features.
Sportradar Group's Earnings Growth And 4.0% ROE
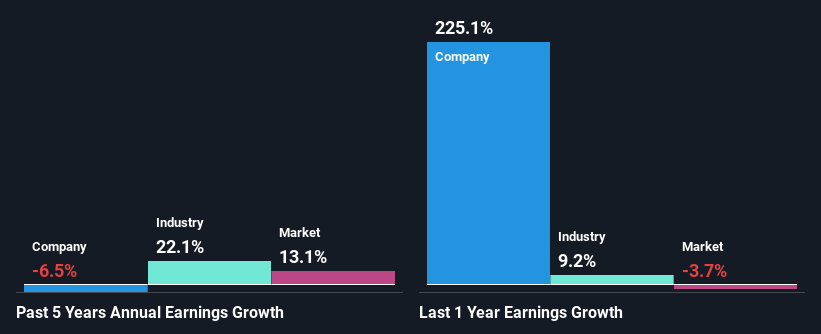
It is hard to argue that Sportradar Group's ROE is much good in and of itself. Not just that, even compared to the industry average of 17%, the company's ROE is entirely unremarkable. For this reason, Sportradar Group's five year net income decline of 6.5% is not surprising given its lower ROE. We reckon that there could also be other factors at play here. Such as - low earnings retention or poor allocation of capital.
However, when we compared Sportradar Group's growth with the industry we found that while the company's earnings have been shrinking, the industry has seen an earnings growth of 22% in the same period. This is quite worrisome.
Earnings growth is an important metric to consider when valuing a stock. The investor should try to establish if the expected growth or decline in earnings, whichever the case may be, is priced in. This then helps them determine if the stock is placed for a bright or bleak future. Is SRAD fairly valued? This infographic on the company's intrinsic value has everything you need to know.
Is Sportradar Group Efficiently Re-investing Its Profits?
Sportradar Group doesn't pay any regular dividends, meaning that potentially all of its profits are being reinvested in the business, which doesn't explain why the company's earnings have shrunk if it is retaining all of its profits. So there could be some other explanations in that regard. For instance, the company's business may be deteriorating.
Summary
On the whole, we feel that the performance shown by Sportradar Group can be open to many interpretations. Even though it appears to be retaining most of its profits, given the low ROE, investors may not be benefitting from all that reinvestment after all. The low earnings growth suggests our theory correct. With that said, we studied the latest analyst forecasts and found that while the company has shrunk its earnings in the past, analysts expect its earnings to grow in the future. Are these analysts expectations based on the broad expectations for the industry, or on the company's fundamentals? Click here to be taken to our analyst's forecasts page for the company.
Valuation is complex, but we're helping make it simple.
Find out whether Sportradar Group is potentially over or undervalued by checking out our comprehensive analysis, which includes fair value estimates, risks and warnings, dividends, insider transactions and financial health.
View the Free AnalysisHave feedback on this article? Concerned about the content? Get in touch with us directly. Alternatively, email editorial-team (at) simplywallst.com.
This article by Simply Wall St is general in nature. We provide commentary based on historical data and analyst forecasts only using an unbiased methodology and our articles are not intended to be financial advice. It does not constitute a recommendation to buy or sell any stock, and does not take account of your objectives, or your financial situation. We aim to bring you long-term focused analysis driven by fundamental data. Note that our analysis may not factor in the latest price-sensitive company announcements or qualitative material. Simply Wall St has no position in any stocks mentioned.
About NasdaqGS:SRAD
Sportradar Group
Provides sports data services for the sports betting and media industries in the United Kingdom, the United States, Malta, Switzerland, and internationally.
Reasonable growth potential with adequate balance sheet.
