
Advertisement
- United States
- /
- Consumer Services
- /
- NasdaqCM:SDA
SunCar Technology Group (NASDAQ:SDA) Is Making Moderate Use Of Debt
Some say volatility, rather than debt, is the best way to think about risk as an investor, but Warren Buffett famously said that 'Volatility is far from synonymous with risk.' So it might be obvious that you need to consider debt, when you think about how risky any given stock is, because too much debt can sink a company. As with many other companies SunCar Technology Group Inc. (NASDAQ:SDA) makes use of debt. But should shareholders be worried about its use of debt?
What Risk Does Debt Bring?
Debt and other liabilities become risky for a business when it cannot easily fulfill those obligations, either with free cash flow or by raising capital at an attractive price. Ultimately, if the company can't fulfill its legal obligations to repay debt, shareholders could walk away with nothing. However, a more frequent (but still costly) occurrence is where a company must issue shares at bargain-basement prices, permanently diluting shareholders, just to shore up its balance sheet. Of course, debt can be an important tool in businesses, particularly capital heavy businesses. When we examine debt levels, we first consider both cash and debt levels, together.
Check out our latest analysis for SunCar Technology Group
How Much Debt Does SunCar Technology Group Carry?
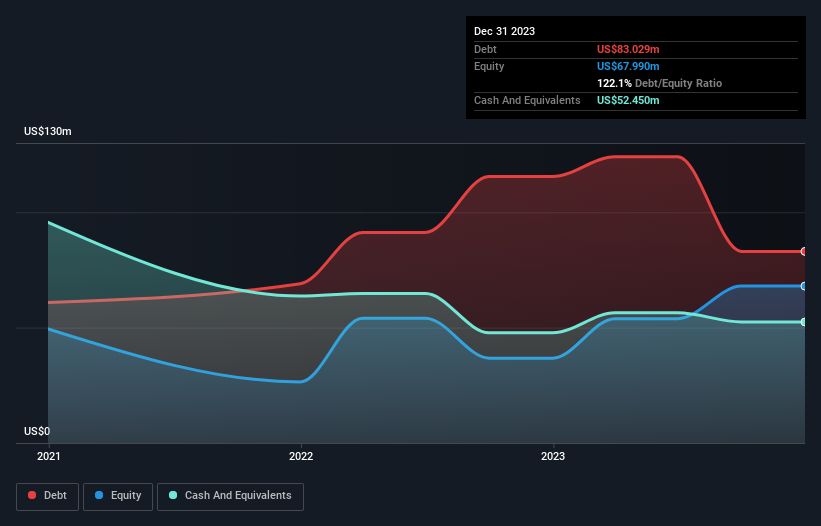
As you can see below, SunCar Technology Group had US$83.0m of debt at December 2023, down from US$115.5m a year prior. However, it also had US$52.5m in cash, and so its net debt is US$30.6m.
How Healthy Is SunCar Technology Group's Balance Sheet?
According to the last reported balance sheet, SunCar Technology Group had liabilities of US$124.4m due within 12 months, and liabilities of US$30.9m due beyond 12 months. Offsetting these obligations, it had cash of US$52.5m as well as receivables valued at US$58.9m due within 12 months. So it has liabilities totalling US$43.9m more than its cash and near-term receivables, combined.
Of course, SunCar Technology Group has a market capitalization of US$722.1m, so these liabilities are probably manageable. However, we do think it is worth keeping an eye on its balance sheet strength, as it may change over time. When analysing debt levels, the balance sheet is the obvious place to start. But it is SunCar Technology Group's earnings that will influence how the balance sheet holds up in the future. So if you're keen to discover more about its earnings, it might be worth checking out this graph of its long term earnings trend.
Over 12 months, SunCar Technology Group reported revenue of US$364m, which is a gain of 29%, although it did not report any earnings before interest and tax. Shareholders probably have their fingers crossed that it can grow its way to profits.
Caveat Emptor
Even though SunCar Technology Group managed to grow its top line quite deftly, the cold hard truth is that it is losing money on the EBIT line. Indeed, it lost US$15m at the EBIT level. When we look at that and recall the liabilities on its balance sheet, relative to cash, it seems unwise to us for the company to have any debt. So we think its balance sheet is a little strained, though not beyond repair. Another cause for caution is that is bled US$33m in negative free cash flow over the last twelve months. So suffice it to say we do consider the stock to be risky. The balance sheet is clearly the area to focus on when you are analysing debt. But ultimately, every company can contain risks that exist outside of the balance sheet. To that end, you should be aware of the 2 warning signs we've spotted with SunCar Technology Group .
Of course, if you're the type of investor who prefers buying stocks without the burden of debt, then don't hesitate to discover our exclusive list of net cash growth stocks, today.
New: Manage All Your Stock Portfolios in One Place
We've created the ultimate portfolio companion for stock investors, and it's free.
• Connect an unlimited number of Portfolios and see your total in one currency
• Be alerted to new Warning Signs or Risks via email or mobile
• Track the Fair Value of your stocks
Have feedback on this article? Concerned about the content? Get in touch with us directly. Alternatively, email editorial-team (at) simplywallst.com.
This article by Simply Wall St is general in nature. We provide commentary based on historical data and analyst forecasts only using an unbiased methodology and our articles are not intended to be financial advice. It does not constitute a recommendation to buy or sell any stock, and does not take account of your objectives, or your financial situation. We aim to bring you long-term focused analysis driven by fundamental data. Note that our analysis may not factor in the latest price-sensitive company announcements or qualitative material. Simply Wall St has no position in any stocks mentioned.
About NasdaqCM:SDA
SunCar Technology Group
Through its subsidiaries, provides cloud and mobile app-based auto eInsurance, technology, and auto services in the People’s Republic of China.
Undervalued with reasonable growth potential.
Market Insights

Advertisement
Community Narratives
The company that turned a verb into a global necessity and basically runs the modern internet, digital ads, smartphones, maps, and AI.
Fair Value US$300.00|7.5% undervalued
OS
Community Contributor
Flowers Foods Pays A Fair Price For Health
Fair Value US$16.12|25.4% undervalued
NV
Community Contributor
TMX Group will thrive with 33.3% profit margin and enduring market moat
Fair Value CA$49.90|3.6% overvalued
LI
Community Contributor
The "Molecular Pencil": Why Beam's Technology is Built to Win
Fair Value US$65.01|65.0% undervalued
DA
Community Contributor