
Advertisement
- United States
- /
- Food and Staples Retail
- /
- NYSE:WMT
Estimating The Intrinsic Value Of Walmart Inc. (NYSE:WMT)
Does the February share price for Walmart Inc. (NYSE:WMT) reflect what it's really worth? Today, we will estimate the stock's intrinsic value by taking the expected future cash flows and discounting them to their present value. This will be done using the Discounted Cash Flow (DCF) model. Before you think you won't be able to understand it, just read on! It's actually much less complex than you'd imagine.
Companies can be valued in a lot of ways, so we would point out that a DCF is not perfect for every situation. If you want to learn more about discounted cash flow, the rationale behind this calculation can be read in detail in the Simply Wall St analysis model.
View our latest analysis for Walmart
Is Walmart fairly valued?
We use what is known as a 2-stage model, which simply means we have two different periods of growth rates for the company's cash flows. Generally the first stage is higher growth, and the second stage is a lower growth phase. In the first stage we need to estimate the cash flows to the business over the next ten years. Where possible we use analyst estimates, but when these aren't available we extrapolate the previous free cash flow (FCF) from the last estimate or reported value. We assume companies with shrinking free cash flow will slow their rate of shrinkage, and that companies with growing free cash flow will see their growth rate slow, over this period. We do this to reflect that growth tends to slow more in the early years than it does in later years.
Generally we assume that a dollar today is more valuable than a dollar in the future, so we need to discount the sum of these future cash flows to arrive at a present value estimate:
10-year free cash flow (FCF) forecast
| 2021 | 2022 | 2023 | 2024 | 2025 | 2026 | 2027 | 2028 | 2029 | 2030 | |
| Levered FCF ($, Millions) | US$19.1b | US$17.2b | US$18.5b | US$20.9b | US$21.9b | US$22.2b | US$22.5b | US$22.8b | US$23.2b | US$23.7b |
| Growth Rate Estimate Source | Analyst x11 | Analyst x11 | Analyst x7 | Analyst x4 | Analyst x3 | Analyst x1 | Est @ 1.44% | Est @ 1.62% | Est @ 1.75% | Est @ 1.84% |
| Present Value ($, Millions) Discounted @ 6.2% | US$18.0k | US$15.2k | US$15.4k | US$16.4k | US$16.2k | US$15.4k | US$14.7k | US$14.1k | US$13.5k | US$12.9k |
("Est" = FCF growth rate estimated by Simply Wall St)
Present Value of 10-year Cash Flow (PVCF) = US$152b
We now need to calculate the Terminal Value, which accounts for all the future cash flows after this ten year period. For a number of reasons a very conservative growth rate is used that cannot exceed that of a country's GDP growth. In this case we have used the 5-year average of the 10-year government bond yield (2.0%) to estimate future growth. In the same way as with the 10-year 'growth' period, we discount future cash flows to today's value, using a cost of equity of 6.2%.
Terminal Value (TV)= FCF2030 × (1 + g) ÷ (r – g) = US$24b× (1 + 2.0%) ÷ (6.2%– 2.0%) = US$577b
Present Value of Terminal Value (PVTV)= TV / (1 + r)10= US$577b÷ ( 1 + 6.2%)10= US$316b
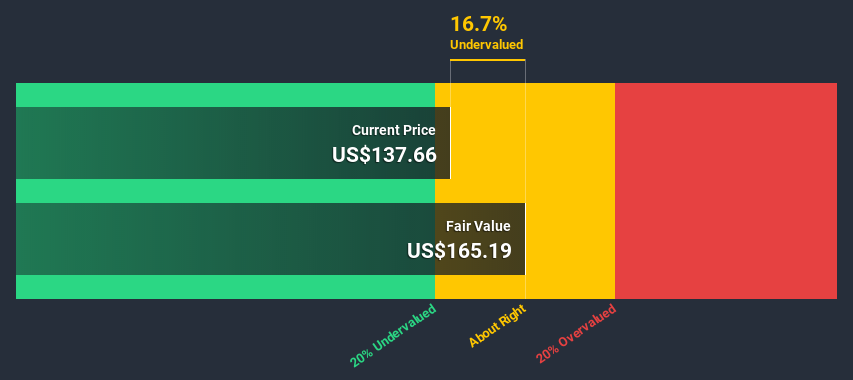
The total value, or equity value, is then the sum of the present value of the future cash flows, which in this case is US$467b. In the final step we divide the equity value by the number of shares outstanding. Compared to the current share price of US$138, the company appears about fair value at a 17% discount to where the stock price trades currently. The assumptions in any calculation have a big impact on the valuation, so it is better to view this as a rough estimate, not precise down to the last cent.
The assumptions
Now the most important inputs to a discounted cash flow are the discount rate, and of course, the actual cash flows. Part of investing is coming up with your own evaluation of a company's future performance, so try the calculation yourself and check your own assumptions. The DCF also does not consider the possible cyclicality of an industry, or a company's future capital requirements, so it does not give a full picture of a company's potential performance. Given that we are looking at Walmart as potential shareholders, the cost of equity is used as the discount rate, rather than the cost of capital (or weighted average cost of capital, WACC) which accounts for debt. In this calculation we've used 6.2%, which is based on a levered beta of 0.800. Beta is a measure of a stock's volatility, compared to the market as a whole. We get our beta from the industry average beta of globally comparable companies, with an imposed limit between 0.8 and 2.0, which is a reasonable range for a stable business.
Looking Ahead:
Valuation is only one side of the coin in terms of building your investment thesis, and it shouldn't be the only metric you look at when researching a company. The DCF model is not a perfect stock valuation tool. Rather it should be seen as a guide to "what assumptions need to be true for this stock to be under/overvalued?" If a company grows at a different rate, or if its cost of equity or risk free rate changes sharply, the output can look very different. For Walmart, we've put together three further aspects you should assess:
- Risks: For example, we've discovered 1 warning sign for Walmart that you should be aware of before investing here.
- Future Earnings: How does WMT's growth rate compare to its peers and the wider market? Dig deeper into the analyst consensus number for the upcoming years by interacting with our free analyst growth expectation chart.
- Other Solid Businesses: Low debt, high returns on equity and good past performance are fundamental to a strong business. Why not explore our interactive list of stocks with solid business fundamentals to see if there are other companies you may not have considered!
PS. The Simply Wall St app conducts a discounted cash flow valuation for every stock on the NYSE every day. If you want to find the calculation for other stocks just search here.
If you’re looking to trade Walmart, open an account with the lowest-cost* platform trusted by professionals, Interactive Brokers. Their clients from over 200 countries and territories trade stocks, options, futures, forex, bonds and funds worldwide from a single integrated account. Promoted
Valuation is complex, but we're here to simplify it.
Discover if Walmart might be undervalued or overvalued with our detailed analysis, featuring fair value estimates, potential risks, dividends, insider trades, and its financial condition.
Access Free AnalysisThis article by Simply Wall St is general in nature. It does not constitute a recommendation to buy or sell any stock, and does not take account of your objectives, or your financial situation. We aim to bring you long-term focused analysis driven by fundamental data. Note that our analysis may not factor in the latest price-sensitive company announcements or qualitative material. Simply Wall St has no position in any stocks mentioned.
*Interactive Brokers Rated Lowest Cost Broker by StockBrokers.com Annual Online Review 2020
Have feedback on this article? Concerned about the content? Get in touch with us directly. Alternatively, email editorial-team (at) simplywallst.com.
About NYSE:WMT
Walmart
Engages in the operation of retail and wholesale stores and clubs, eCommerce websites, and mobile applications worldwide.
Outstanding track record with excellent balance sheet and pays a dividend.
Similar Companies
Market Insights

Advertisement
Community Narratives
MicroVision will explode future revenue by 380.37% with a vision towards success
Fair Value US$60|98.4% undervalued
TH
Community Contributor
The Indispensable Artery for a New North American Economy
Fair Value CA$132.87|0.7% overvalued
TI
Community Contributor
Recently Updated Narratives
CO

composite32 on Astor Enerji ·
Astor Enerji will surge with a fair value of $140.43 in the next 3 years
Fair Value:₺140.4335.5% undervalued
1 followerusers have followed this narrative
0 commentsusers have commented on this narrative
0 likesusers have liked this narrative
RE

RecMag on Proximus ·
Proximus: The State-Backed Backup Plan with 7% Gross Yield and 15% Currency Upside.
Fair Value:€17.1356.7% undervalued
29 followersusers have followed this narrative
0 commentsusers have commented on this narrative
0 likesusers have liked this narrative
SW

swift11 on DXC Technology ·
CEO: We are winners in the long term in the AI world
Fair Value:US$17.4624.4% undervalued
1 followerusers have followed this narrative
0 commentsusers have commented on this narrative
0 likesusers have liked this narrative
Popular Narratives
TH

TheWallstreetKing on MicroVision ·
MicroVision will explode future revenue by 380.37% with a vision towards success
Fair Value:US$6098.4% undervalued
101 followersusers have followed this narrative
10 commentsusers have commented on this narrative
20 likesusers have liked this narrative
OS


oscargarcia on Alphabet ·
The company that turned a verb into a global necessity and basically runs the modern internet, digital ads, smartphones, maps, and AI.
Fair Value:US$3405.8% undervalued
137 followersusers have followed this narrative
6 commentsusers have commented on this narrative
18 likesusers have liked this narrative
AN


AnalystConsensusTarget on NVIDIA ·
NVDA: Expanding AI Demand Will Drive Major Data Center Investments Through 2026
Fair Value:US$232.7924.0% undervalued
929 followersusers have followed this narrative
6 commentsusers have commented on this narrative
22 likesusers have liked this narrative