Stock Analysis
- United States
- /
- Food and Staples Retail
- /
- NYSE:PFGC
Are Strong Financial Prospects The Force That Is Driving The Momentum In Performance Food Group Company's NYSE:PFGC) Stock?

Performance Food Group (NYSE:PFGC) has had a great run on the share market with its stock up by a significant 32% over the last three months. Given the company's impressive performance, we decided to study its financial indicators more closely as a company's financial health over the long-term usually dictates market outcomes. Particularly, we will be paying attention to Performance Food Group's ROE today.
Return on Equity or ROE is a test of how effectively a company is growing its value and managing investors’ money. In other words, it is a profitability ratio which measures the rate of return on the capital provided by the company's shareholders.
Check out our latest analysis for Performance Food Group
How Do You Calculate Return On Equity?
Return on equity can be calculated by using the formula:
Return on Equity = Net Profit (from continuing operations) ÷ Shareholders' Equity
So, based on the above formula, the ROE for Performance Food Group is:
11% = US$422m ÷ US$3.8b (Based on the trailing twelve months to September 2023).
The 'return' is the yearly profit. That means that for every $1 worth of shareholders' equity, the company generated $0.11 in profit.
What Has ROE Got To Do With Earnings Growth?
Thus far, we have learned that ROE measures how efficiently a company is generating its profits. We now need to evaluate how much profit the company reinvests or "retains" for future growth which then gives us an idea about the growth potential of the company. Assuming all else is equal, companies that have both a higher return on equity and higher profit retention are usually the ones that have a higher growth rate when compared to companies that don't have the same features.
A Side By Side comparison of Performance Food Group's Earnings Growth And 11% ROE
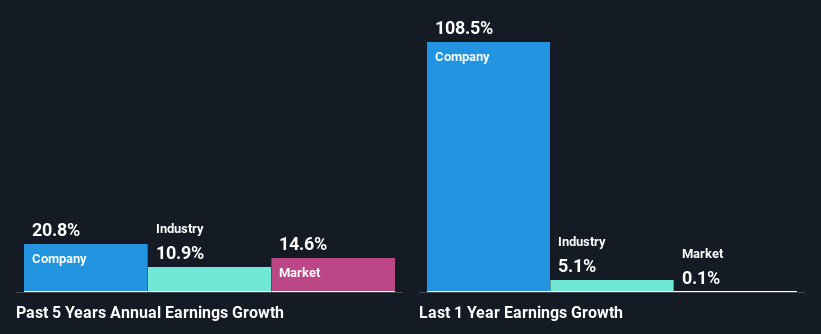
To start with, Performance Food Group's ROE looks acceptable. Be that as it may, the company's ROE is still quite lower than the industry average of 14%. However, we are pleased to see the impressive 21% net income growth reported by Performance Food Group over the past five years. We believe that there might be other aspects that are positively influencing the company's earnings growth. For example, it is possible that the company's management has made some good strategic decisions, or that the company has a low payout ratio. However, not to forget, the company does have a decent ROE to begin with, just that it is lower than the industry average. So this certainly also provides some context to the high earnings growth seen by the company.
As a next step, we compared Performance Food Group's net income growth with the industry, and pleasingly, we found that the growth seen by the company is higher than the average industry growth of 11%.
Earnings growth is an important metric to consider when valuing a stock. It’s important for an investor to know whether the market has priced in the company's expected earnings growth (or decline). Doing so will help them establish if the stock's future looks promising or ominous. Has the market priced in the future outlook for PFGC? You can find out in our latest intrinsic value infographic research report.
Is Performance Food Group Efficiently Re-investing Its Profits?
Given that Performance Food Group doesn't pay any dividend to its shareholders, we infer that the company has been reinvesting all of its profits to grow its business.
Summary
In total, we are pretty happy with Performance Food Group's performance. Particularly, we like that the company is reinvesting heavily into its business at a moderate rate of return. Unsurprisingly, this has led to an impressive earnings growth. We also studied the latest analyst forecasts and found that the company's earnings growth is expected be similar to its current growth rate. Are these analysts expectations based on the broad expectations for the industry, or on the company's fundamentals? Click here to be taken to our analyst's forecasts page for the company.
Valuation is complex, but we're helping make it simple.
Find out whether Performance Food Group is potentially over or undervalued by checking out our comprehensive analysis, which includes fair value estimates, risks and warnings, dividends, insider transactions and financial health.
View the Free AnalysisHave feedback on this article? Concerned about the content? Get in touch with us directly. Alternatively, email editorial-team (at) simplywallst.com.
This article by Simply Wall St is general in nature. We provide commentary based on historical data and analyst forecasts only using an unbiased methodology and our articles are not intended to be financial advice. It does not constitute a recommendation to buy or sell any stock, and does not take account of your objectives, or your financial situation. We aim to bring you long-term focused analysis driven by fundamental data. Note that our analysis may not factor in the latest price-sensitive company announcements or qualitative material. Simply Wall St has no position in any stocks mentioned.
About NYSE:PFGC
Performance Food Group
Performance Food Group Company, through its subsidiaries, markets and distributes food and food-related products in the United States.
Solid track record with excellent balance sheet.

