Stock Analysis
- United States
- /
- Consumer Durables
- /
- NYSE:TPX
Tempur Sealy International's (NYSE:TPX) earnings growth rate lags the 27% CAGR delivered to shareholders


The most you can lose on any stock (assuming you don't use leverage) is 100% of your money. But when you pick a company that is really flourishing, you can make more than 100%. One great example is Tempur Sealy International, Inc. (NYSE:TPX) which saw its share price drive 223% higher over five years. On the other hand, the stock price has retraced 6.8% in the last week. But note that the broader market is down 3.5% since last week, and this may have impacted Tempur Sealy International's share price.
In light of the stock dropping 6.8% in the past week, we want to investigate the longer term story, and see if fundamentals have been the driver of the company's positive five-year return.
Check out our latest analysis for Tempur Sealy International
To quote Buffett, 'Ships will sail around the world but the Flat Earth Society will flourish. There will continue to be wide discrepancies between price and value in the marketplace...' One flawed but reasonable way to assess how sentiment around a company has changed is to compare the earnings per share (EPS) with the share price.
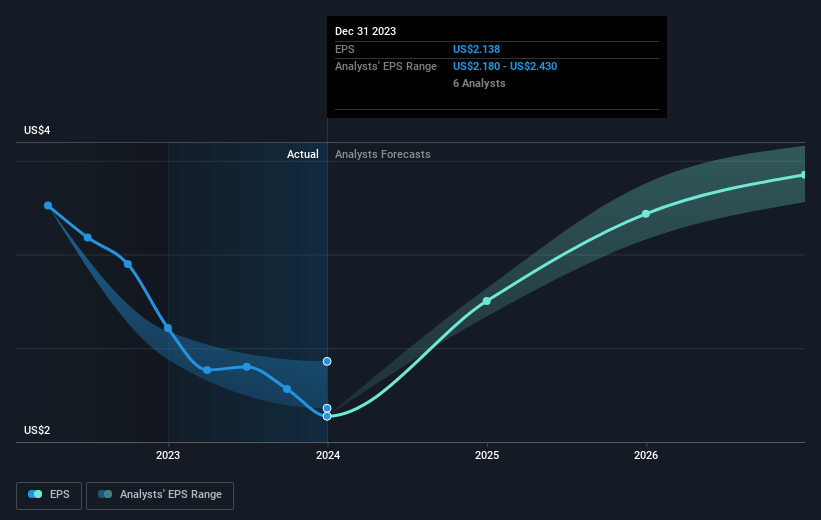
During five years of share price growth, Tempur Sealy International achieved compound earnings per share (EPS) growth of 31% per year. This EPS growth is reasonably close to the 26% average annual increase in the share price. This indicates that investor sentiment towards the company has not changed a great deal. In fact, the share price seems to largely reflect the EPS growth.
The image below shows how EPS has tracked over time (if you click on the image you can see greater detail).
This free interactive report on Tempur Sealy International's earnings, revenue and cash flow is a great place to start, if you want to investigate the stock further.
What About Dividends?
As well as measuring the share price return, investors should also consider the total shareholder return (TSR). The TSR is a return calculation that accounts for the value of cash dividends (assuming that any dividend received was reinvested) and the calculated value of any discounted capital raisings and spin-offs. So for companies that pay a generous dividend, the TSR is often a lot higher than the share price return. We note that for Tempur Sealy International the TSR over the last 5 years was 234%, which is better than the share price return mentioned above. And there's no prize for guessing that the dividend payments largely explain the divergence!
A Different Perspective
It's nice to see that Tempur Sealy International shareholders have received a total shareholder return of 31% over the last year. Of course, that includes the dividend. That gain is better than the annual TSR over five years, which is 27%. Therefore it seems like sentiment around the company has been positive lately. Someone with an optimistic perspective could view the recent improvement in TSR as indicating that the business itself is getting better with time. While it is well worth considering the different impacts that market conditions can have on the share price, there are other factors that are even more important. Take risks, for example - Tempur Sealy International has 2 warning signs we think you should be aware of.
But note: Tempur Sealy International may not be the best stock to buy. So take a peek at this free list of interesting companies with past earnings growth (and further growth forecast).
Please note, the market returns quoted in this article reflect the market weighted average returns of stocks that currently trade on American exchanges.
Valuation is complex, but we're helping make it simple.
Find out whether Tempur Sealy International is potentially over or undervalued by checking out our comprehensive analysis, which includes fair value estimates, risks and warnings, dividends, insider transactions and financial health.
View the Free AnalysisHave feedback on this article? Concerned about the content? Get in touch with us directly. Alternatively, email editorial-team (at) simplywallst.com.
This article by Simply Wall St is general in nature. We provide commentary based on historical data and analyst forecasts only using an unbiased methodology and our articles are not intended to be financial advice. It does not constitute a recommendation to buy or sell any stock, and does not take account of your objectives, or your financial situation. We aim to bring you long-term focused analysis driven by fundamental data. Note that our analysis may not factor in the latest price-sensitive company announcements or qualitative material. Simply Wall St has no position in any stocks mentioned.
About NYSE:TPX
Tempur Sealy International
Tempur Sealy International, Inc., together with its subsidiaries, designs, manufactures, distributes, and retails bedding products in the United States and internationally.
Fair value with mediocre balance sheet.
