- United States
- /
- Consumer Durables
- /
- NYSE:DHI
D.R. Horton, Inc.'s (NYSE:DHI) Stock's On An Uptrend: Are Strong Financials Guiding The Market?


D.R. Horton's (NYSE:DHI) stock is up by a considerable 28% over the past three months. Given the company's impressive performance, we decided to study its financial indicators more closely as a company's financial health over the long-term usually dictates market outcomes. Specifically, we decided to study D.R. Horton's ROE in this article.
ROE or return on equity is a useful tool to assess how effectively a company can generate returns on the investment it received from its shareholders. In other words, it is a profitability ratio which measures the rate of return on the capital provided by the company's shareholders.
See our latest analysis for D.R. Horton
How To Calculate Return On Equity?
The formula for return on equity is:
Return on Equity = Net Profit (from continuing operations) ÷ Shareholders' Equity
So, based on the above formula, the ROE for D.R. Horton is:
20% = US$5.0b ÷ US$25b (Based on the trailing twelve months to June 2024).
The 'return' is the amount earned after tax over the last twelve months. That means that for every $1 worth of shareholders' equity, the company generated $0.20 in profit.
What Has ROE Got To Do With Earnings Growth?
So far, we've learned that ROE is a measure of a company's profitability. We now need to evaluate how much profit the company reinvests or "retains" for future growth which then gives us an idea about the growth potential of the company. Generally speaking, other things being equal, firms with a high return on equity and profit retention, have a higher growth rate than firms that don’t share these attributes.
D.R. Horton's Earnings Growth And 20% ROE
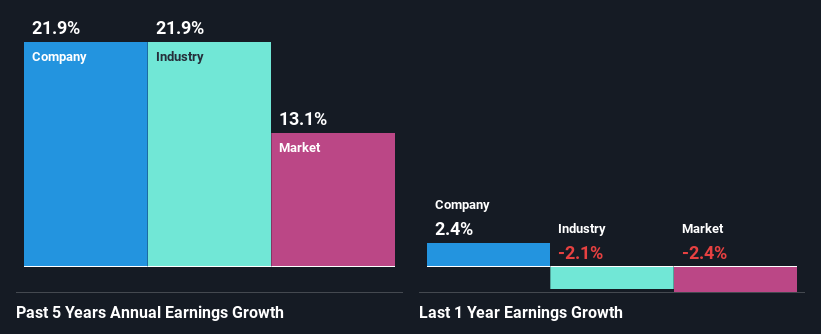
To begin with, D.R. Horton seems to have a respectable ROE. Further, the company's ROE compares quite favorably to the industry average of 15%. This certainly adds some context to D.R. Horton's exceptional 22% net income growth seen over the past five years. We believe that there might also be other aspects that are positively influencing the company's earnings growth. For instance, the company has a low payout ratio or is being managed efficiently.
Next, on comparing D.R. Horton's net income growth with the industry, we found that the company's reported growth is similar to the industry average growth rate of 22% over the last few years.
Earnings growth is an important metric to consider when valuing a stock. What investors need to determine next is if the expected earnings growth, or the lack of it, is already built into the share price. This then helps them determine if the stock is placed for a bright or bleak future. What is DHI worth today? The intrinsic value infographic in our free research report helps visualize whether DHI is currently mispriced by the market.
Is D.R. Horton Making Efficient Use Of Its Profits?
D.R. Horton's ' three-year median payout ratio is on the lower side at 6.9% implying that it is retaining a higher percentage (93%) of its profits. This suggests that the management is reinvesting most of the profits to grow the business as evidenced by the growth seen by the company.
Besides, D.R. Horton has been paying dividends for at least ten years or more. This shows that the company is committed to sharing profits with its shareholders. Looking at the current analyst consensus data, we can see that the company's future payout ratio is expected to rise to 8.5% over the next three years. However, the company's ROE is not expected to change by much despite the higher expected payout ratio.
Conclusion
Overall, we are quite pleased with D.R. Horton's performance. In particular, it's great to see that the company is investing heavily into its business and along with a high rate of return, that has resulted in a sizeable growth in its earnings. That being so, a study of the latest analyst forecasts show that the company is expected to see a slowdown in its future earnings growth. To know more about the latest analysts predictions for the company, check out this visualization of analyst forecasts for the company.
New: Manage All Your Stock Portfolios in One Place
We've created the ultimate portfolio companion for stock investors, and it's free.
• Connect an unlimited number of Portfolios and see your total in one currency
• Be alerted to new Warning Signs or Risks via email or mobile
• Track the Fair Value of your stocks
Have feedback on this article? Concerned about the content? Get in touch with us directly. Alternatively, email editorial-team (at) simplywallst.com.
This article by Simply Wall St is general in nature. We provide commentary based on historical data and analyst forecasts only using an unbiased methodology and our articles are not intended to be financial advice. It does not constitute a recommendation to buy or sell any stock, and does not take account of your objectives, or your financial situation. We aim to bring you long-term focused analysis driven by fundamental data. Note that our analysis may not factor in the latest price-sensitive company announcements or qualitative material. Simply Wall St has no position in any stocks mentioned.
About NYSE:DHI
D.R. Horton
Operates as a homebuilding company in East, North, Southeast, South Central, Southwest, and Northwest regions in the United States.
Excellent balance sheet and good value.

