Advertisement
- United States
- /
- Commercial Services
- /
- NYSE:HNI
Is HNI’s Share Price Drop a Sign of Opportunity in 2025?

Simply Wall St
Reviewed by Bailey Pemberton
- Wondering if HNI is a hidden gem or if the current price reflects its true worth? You are not alone, and there is a lot more to the story than meets the eye.
- The stock has seen some volatility lately, dropping 9.6% over the last week and 12.1% in the past month. Its year-to-date return is -17.2%, although it is still up 58.0% over three years.
- Several recent news stories have highlighted industry-wide shifts in workplace trends and demand for commercial furniture, which helps explain some of HNI’s recent stock movements. Attention has also focused on the company’s evolving product lines and strategic acquisitions as it navigates an uncertain office environment.
- On our valuation dashboard, HNI earns a score of 6 out of 6, ticking the boxes for every undervaluation check we apply. We will dig into what drives that score across multiple valuation methods and offer insights into an even more powerful way to gauge value at the end of this article.
Find out why HNI's -15.3% return over the last year is lagging behind its peers.
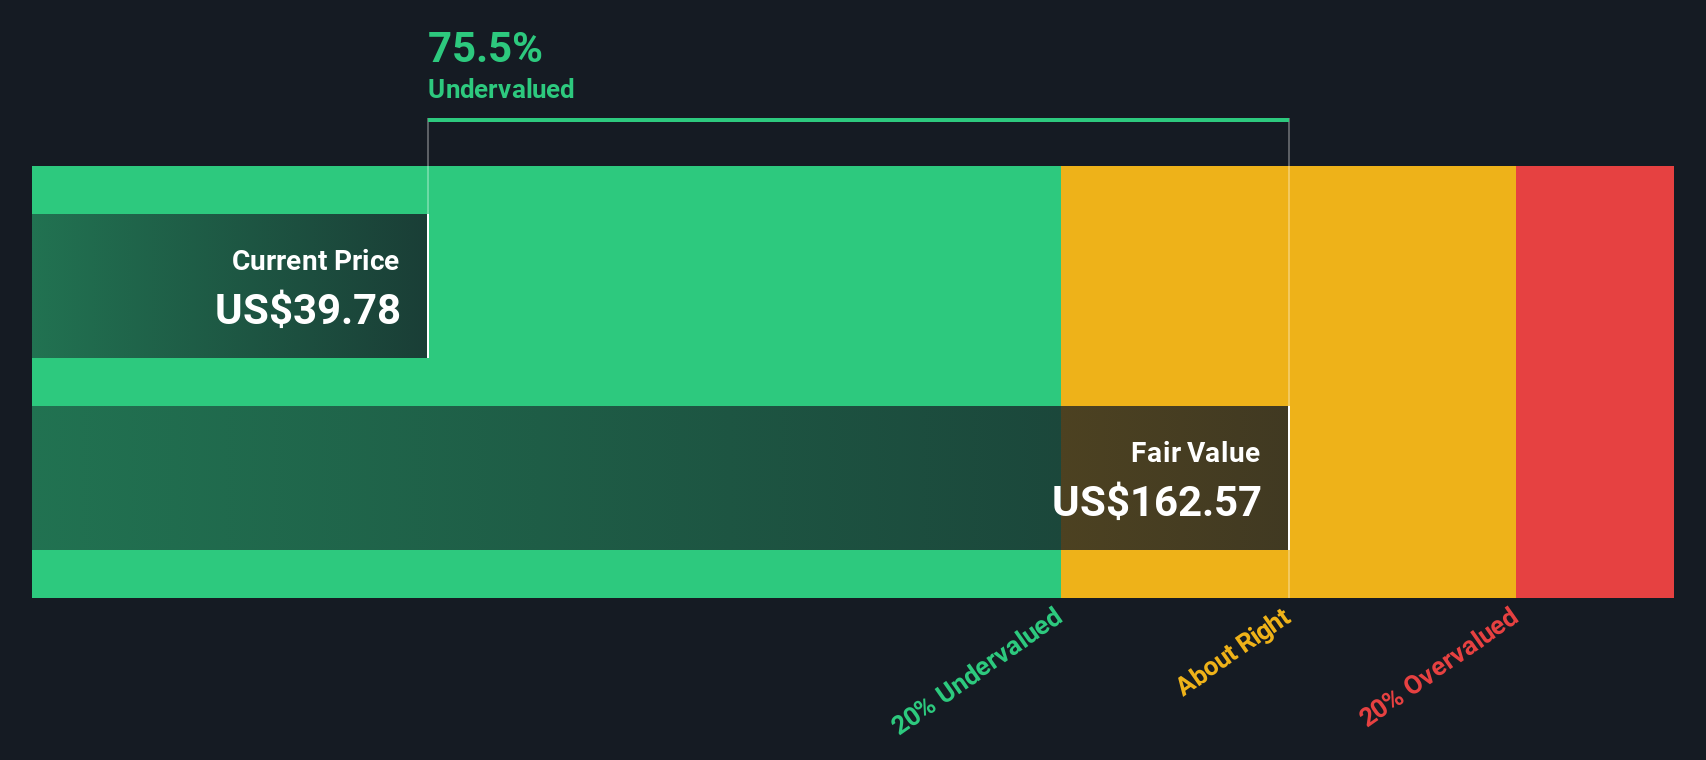
Approach 1: HNI Discounted Cash Flow (DCF) Analysis
The Discounted Cash Flow (DCF) model estimates a company's worth by projecting its future cash flows and discounting them back to their value today. By using this approach, investors can assess what the business is fundamentally worth compared to its current share price.
For HNI, the DCF analysis uses a 2 Stage Free Cash Flow to Equity model. The company’s most recent free cash flow is $179.88 million, with analysts forecasting steady growth in the coming years. By 2027, free cash flow is projected to rise to around $240.57 million. Further estimates extrapolated by the model show this figure reaching approximately $364.50 million by 2035.
After discounting all of these future cash flows back to today’s dollars, the model derives an estimated intrinsic value of $140.22 per share. This figure implies that HNI is trading at a sharp 70.8% discount to its calculated fair value based on projected cash flows.
All things considered, the DCF points to an attractive entry point for value-focused investors who believe the company’s cash flow growth can be realized.
Result: UNDERVALUED
Our Discounted Cash Flow (DCF) analysis suggests HNI is undervalued by 70.8%. Track this in your watchlist or portfolio, or discover 834 more undervalued stocks based on cash flows.
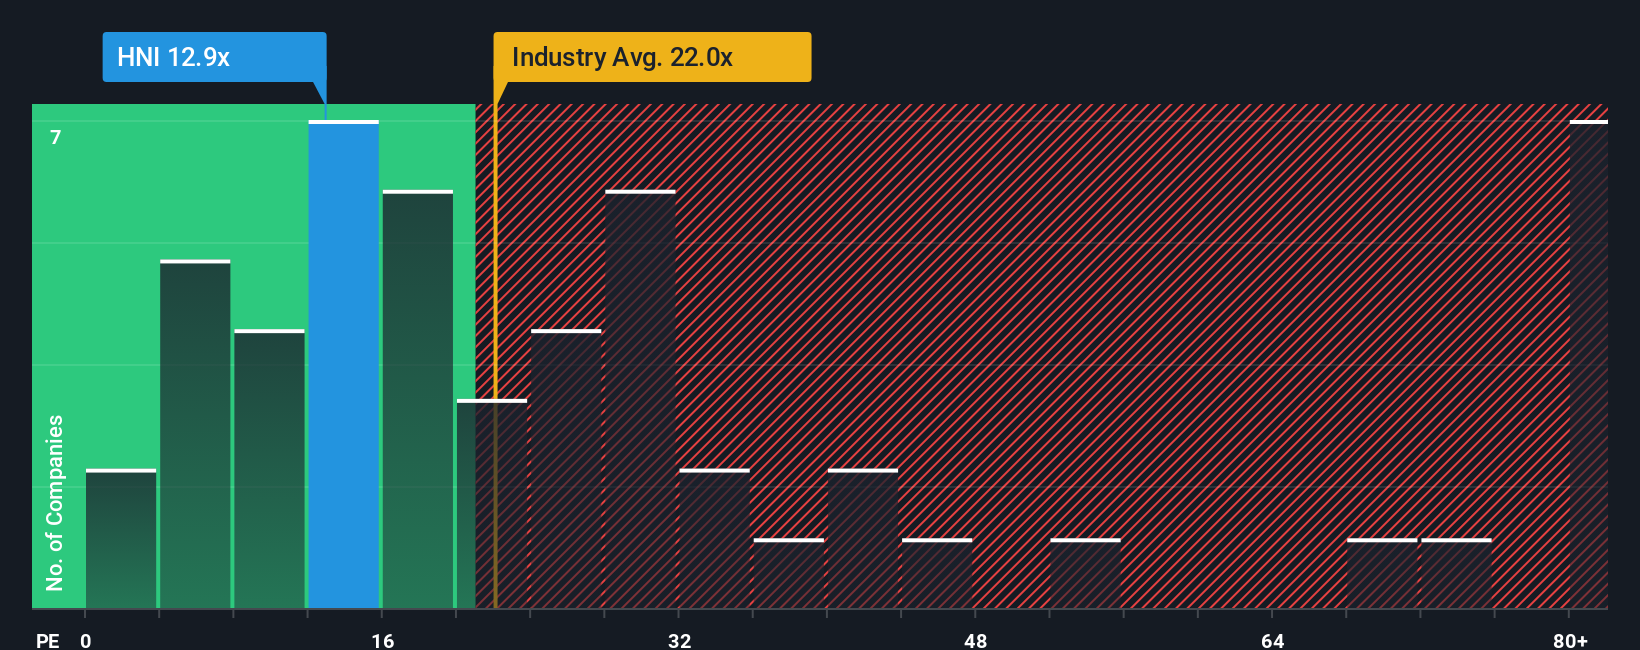
Approach 2: HNI Price vs Earnings
The Price-to-Earnings (PE) ratio is one of the most common methods used to value profitable companies, as it links a company's current share price to its earnings per share. A lower PE may indicate an undervalued stock, especially if the company is expected to grow or is more profitable than its peers.
What is considered a "normal" or "fair" PE ratio can vary based on growth expectations and business risks. Companies with strong future prospects or lower perceived risks often trade at higher PE ratios. In contrast, slower growers or more uncertain businesses tend to be assigned lower multiples by the market.
HNI currently trades on a PE of 13.2x, which is well below the Commercial Services industry average of 22.3x and also trails the peer group average of 19.5x. However, looking only at industry and peer multiples can overlook business-specific drivers and risks that may justify a higher or lower valuation.
This is where the Simply Wall St "Fair Ratio" comes in. The Fair Ratio for HNI is calculated at 25.2x, taking into account the company’s growth outlook, profit margins, risk profile, and market cap, as well as industry factors. By combining these metrics, the Fair Ratio provides a more tailored view of what HNI should be worth based on its unique fundamentals.
Comparing the Fair Ratio with HNI’s actual PE, the stock appears to be significantly cheaper than its fair value estimate. This suggests a potential opportunity for investors who believe in the business’s future prospects and risk profile.
Result: UNDERVALUED
PE ratios tell one story, but what if the real opportunity lies elsewhere? Discover 1410 companies where insiders are betting big on explosive growth.
Upgrade Your Decision Making: Choose your HNI Narrative
Earlier we mentioned that there is an even better way to understand valuation, so let's introduce you to Narratives, a smarter, more dynamic approach to investment decisions that goes beyond formulas and ratios.
A Narrative is your personal story about a company, connecting what you believe about its future, such as its growth drivers, business risks, or strategic strengths, to concrete financial forecasts and an estimated fair value.
On Simply Wall St’s Community page, millions of investors use Narratives as an accessible tool to express their perspectives, test assumptions, and see in real time how their outlook translates into a fair value for the stock.
Narratives make it easy to decide when to buy or sell by clearly showing how your view of the business compares its fair value to the current market price, and they are automatically updated whenever new financial results or news emerge.
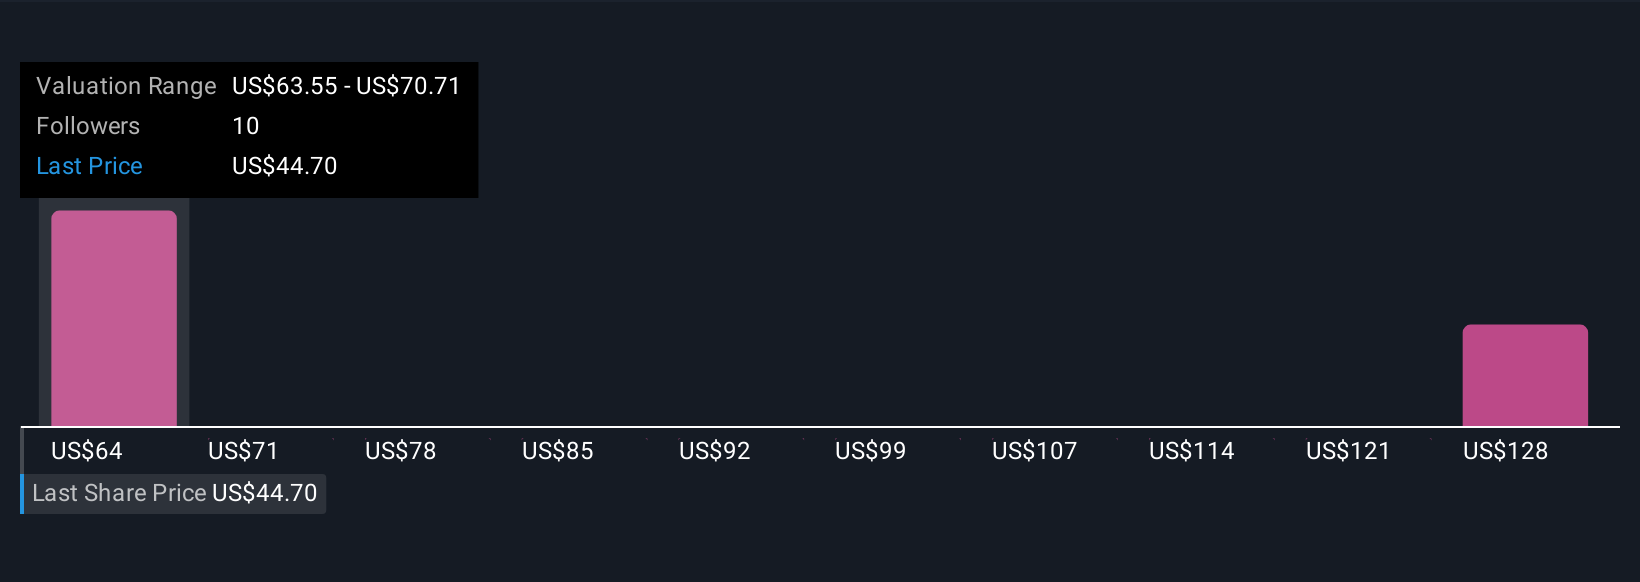
For example, regarding HNI, some investors are optimistic and see long-term value in its innovation, assigning a fair value of $73.00 per share, while others remain cautious due to market headwinds, setting a target as low as $60.00. This demonstrates how Narratives help bring diverse, data-driven perspectives together for better decision making.
Do you think there's more to the story for HNI? Head over to our Community to see what others are saying!
This article by Simply Wall St is general in nature. We provide commentary based on historical data and analyst forecasts only using an unbiased methodology and our articles are not intended to be financial advice. It does not constitute a recommendation to buy or sell any stock, and does not take account of your objectives, or your financial situation. We aim to bring you long-term focused analysis driven by fundamental data. Note that our analysis may not factor in the latest price-sensitive company announcements or qualitative material. Simply Wall St has no position in any stocks mentioned.
Valuation is complex, but we're here to simplify it.
Discover if HNI might be undervalued or overvalued with our detailed analysis, featuring fair value estimates, potential risks, dividends, insider trades, and its financial condition.
Access Free AnalysisHave feedback on this article? Concerned about the content? Get in touch with us directly. Alternatively, email editorial-team@simplywallst.com
About NYSE:HNI
HNI
Engages in the manufacture, sale, and marketing of workplace furnishings and residential building products primarily in the United States and Canada.
Very undervalued established dividend payer.
Similar Companies
Market Insights

Advertisement
Community Narratives
The company that turned a verb into a global necessity and basically runs the modern internet, digital ads, smartphones, maps, and AI.
Fair Value US$300.00|6.2% undervalued
OS
Community Contributor
Flowers Foods Pays A Fair Price For Health
Fair Value US$16.12|26.0% undervalued
NV
Community Contributor
TMX Group will thrive with 33.3% profit margin and enduring market moat
Fair Value CA$49.90|3.7% overvalued
LI
Community Contributor