- United States
- /
- Commercial Services
- /
- NYSE:BCO
Brink's' (NYSE:BCO) three-year earnings growth trails the decent shareholder returns


One simple way to benefit from the stock market is to buy an index fund. But if you choose individual stocks with prowess, you can make superior returns. For example, the The Brink's Company (NYSE:BCO) share price is up 55% in the last three years, clearly besting the market return of around 15% (not including dividends).
The past week has proven to be lucrative for Brink's investors, so let's see if fundamentals drove the company's three-year performance.
View our latest analysis for Brink's
There is no denying that markets are sometimes efficient, but prices do not always reflect underlying business performance. One flawed but reasonable way to assess how sentiment around a company has changed is to compare the earnings per share (EPS) with the share price.
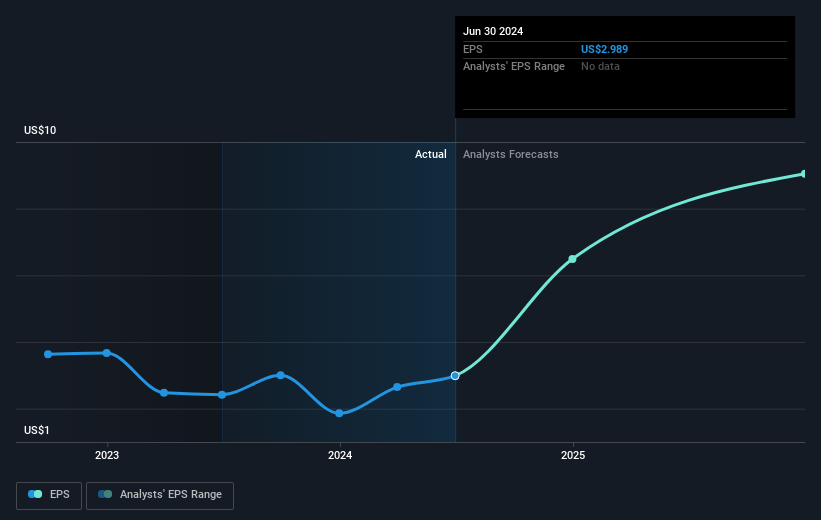
During three years of share price growth, Brink's achieved compound earnings per share growth of 59% per year. The average annual share price increase of 16% is actually lower than the EPS growth. Therefore, it seems the market has moderated its expectations for growth, somewhat.
The image below shows how EPS has tracked over time (if you click on the image you can see greater detail).
We know that Brink's has improved its bottom line over the last three years, but what does the future have in store? You can see how its balance sheet has strengthened (or weakened) over time in this free interactive graphic.
What About Dividends?
It is important to consider the total shareholder return, as well as the share price return, for any given stock. Whereas the share price return only reflects the change in the share price, the TSR includes the value of dividends (assuming they were reinvested) and the benefit of any discounted capital raising or spin-off. It's fair to say that the TSR gives a more complete picture for stocks that pay a dividend. We note that for Brink's the TSR over the last 3 years was 60%, which is better than the share price return mentioned above. And there's no prize for guessing that the dividend payments largely explain the divergence!
A Different Perspective
We're pleased to report that Brink's shareholders have received a total shareholder return of 47% over one year. Of course, that includes the dividend. That gain is better than the annual TSR over five years, which is 7%. Therefore it seems like sentiment around the company has been positive lately. Given the share price momentum remains strong, it might be worth taking a closer look at the stock, lest you miss an opportunity. I find it very interesting to look at share price over the long term as a proxy for business performance. But to truly gain insight, we need to consider other information, too. Even so, be aware that Brink's is showing 2 warning signs in our investment analysis , and 1 of those is a bit unpleasant...
Of course Brink's may not be the best stock to buy. So you may wish to see this free collection of growth stocks.
Please note, the market returns quoted in this article reflect the market weighted average returns of stocks that currently trade on American exchanges.
Valuation is complex, but we're here to simplify it.
Discover if Brink's might be undervalued or overvalued with our detailed analysis, featuring fair value estimates, potential risks, dividends, insider trades, and its financial condition.
Access Free AnalysisHave feedback on this article? Concerned about the content? Get in touch with us directly. Alternatively, email editorial-team (at) simplywallst.com.
This article by Simply Wall St is general in nature. We provide commentary based on historical data and analyst forecasts only using an unbiased methodology and our articles are not intended to be financial advice. It does not constitute a recommendation to buy or sell any stock, and does not take account of your objectives, or your financial situation. We aim to bring you long-term focused analysis driven by fundamental data. Note that our analysis may not factor in the latest price-sensitive company announcements or qualitative material. Simply Wall St has no position in any stocks mentioned.
About NYSE:BCO
Brink's
Provides secure transportation, cash management, and other security-related services in North America, Latin America, Europe, and internationally.
Good value average dividend payer.

