Advertisement
- United States
- /
- Commercial Services
- /
- NasdaqGS:TILE
Is Interface’s New Sustainability Push Driving a Hidden Opportunity for Investors in 2025?

Simply Wall St
Reviewed by Bailey Pemberton
- Wondering if Interface stock is still an under-the-radar bargain or if the market has finally caught up? Let’s break down what’s really happening beneath the share price.
- Even though shares are up 7.5% year-to-date and have soared 205.0% over five years, the stock has cooled recently with a slight drop of 0.4% this week and 1.8% over the last month.
- Interface has been in the headlines for its new sustainability partnerships and product launches, which may be fueling optimism and offering fresh catalysts for price movement. Ongoing attention to eco-friendly initiatives is also drawing interest from investors looking for long-term growth stories.
- With a rock-solid 6 out of 6 valuation score, Interface seems worth a closer look. Let’s dive into traditional valuation approaches, then wrap up with an even smarter way to value the business at the end of this article.
Approach 1: Interface Discounted Cash Flow (DCF) Analysis
A Discounted Cash Flow (DCF) model seeks to estimate a company's value by projecting its future cash flows and then discounting them back to today's value. This approach allows investors to measure what the business is worth at present based on expected future performance.
For Interface, the DCF model uses the 2 Stage Free Cash Flow to Equity approach. The company currently generates approximately $125.2 million in free cash flow. Analysts' forecasts imply annual free cash flow growth of around 4-5% for the next several years, with projections expanding to about $182.2 million by 2035, based on available estimates.
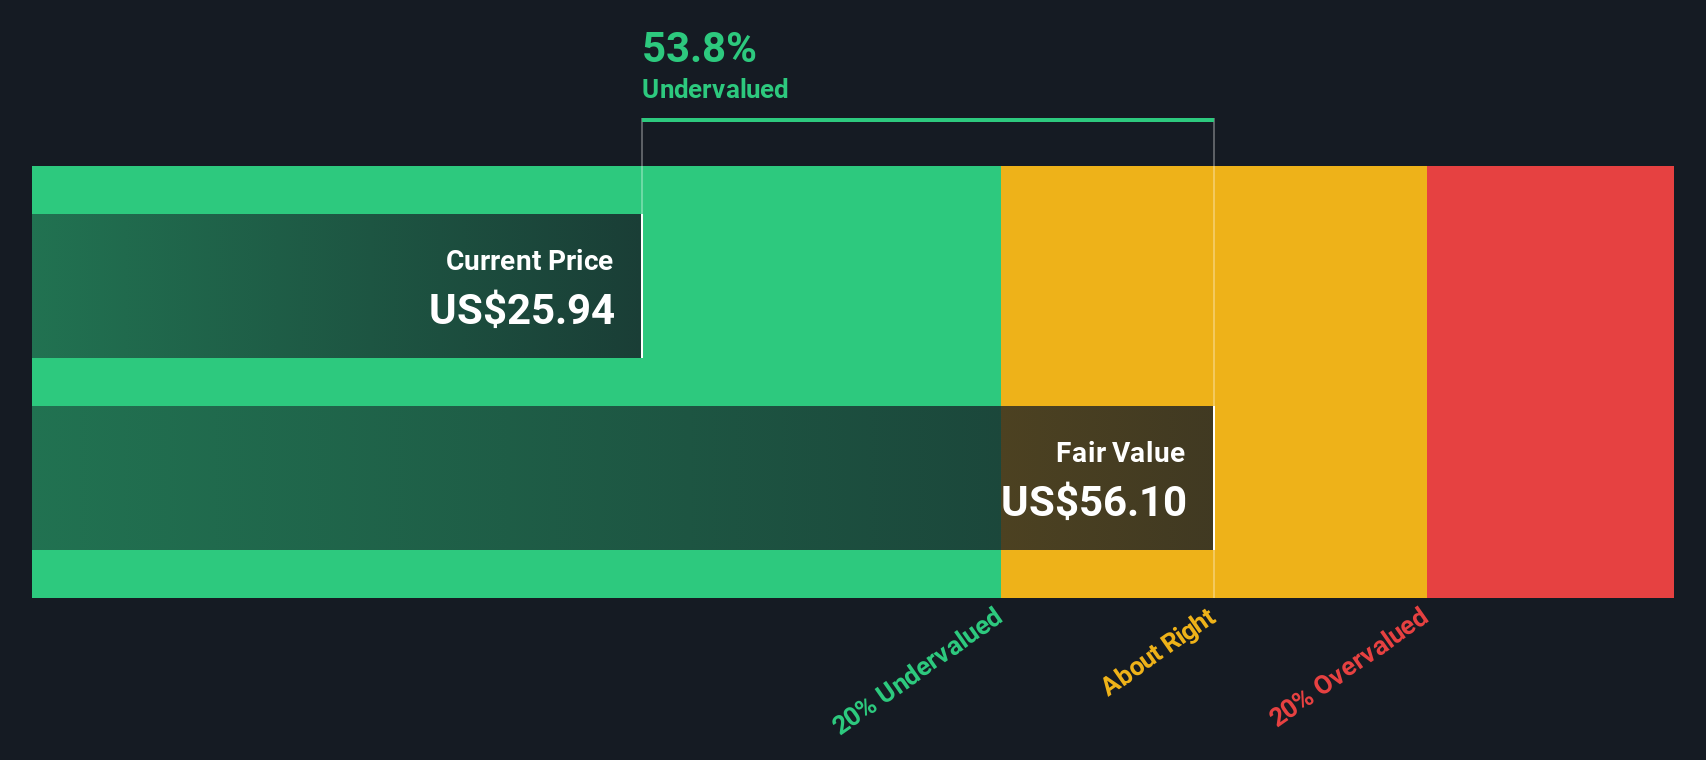
After discounting all future cash flows to present value terms, the DCF analysis calculates an estimated intrinsic value per share of $56.50. Compared to Interface’s current share price, this model suggests the stock is trading at a steep 54.4% discount, indicating significant undervaluation by the market.
Result: UNDERVALUED
Our Discounted Cash Flow (DCF) analysis suggests Interface is undervalued by 54.4%. Track this in your watchlist or portfolio, or discover 882 more undervalued stocks based on cash flows.
Approach 2: Interface Price vs Earnings (PE Ratio)
The Price-to-Earnings (PE) ratio is often the go-to metric for valuing profitable companies like Interface because it directly links a company's market price with its actual earnings. Investors and analysts favor the PE ratio as it quickly spotlights whether a stock appears cheap or expensive relative to its profit stream.
A “normal” or “fair” PE ratio varies by company and industry, depending on expectations for future growth and the risks involved. Higher growth companies or those with stable, predictable profits tend to command higher PE ratios, while riskier or slower-growing firms trade on lower multiples.
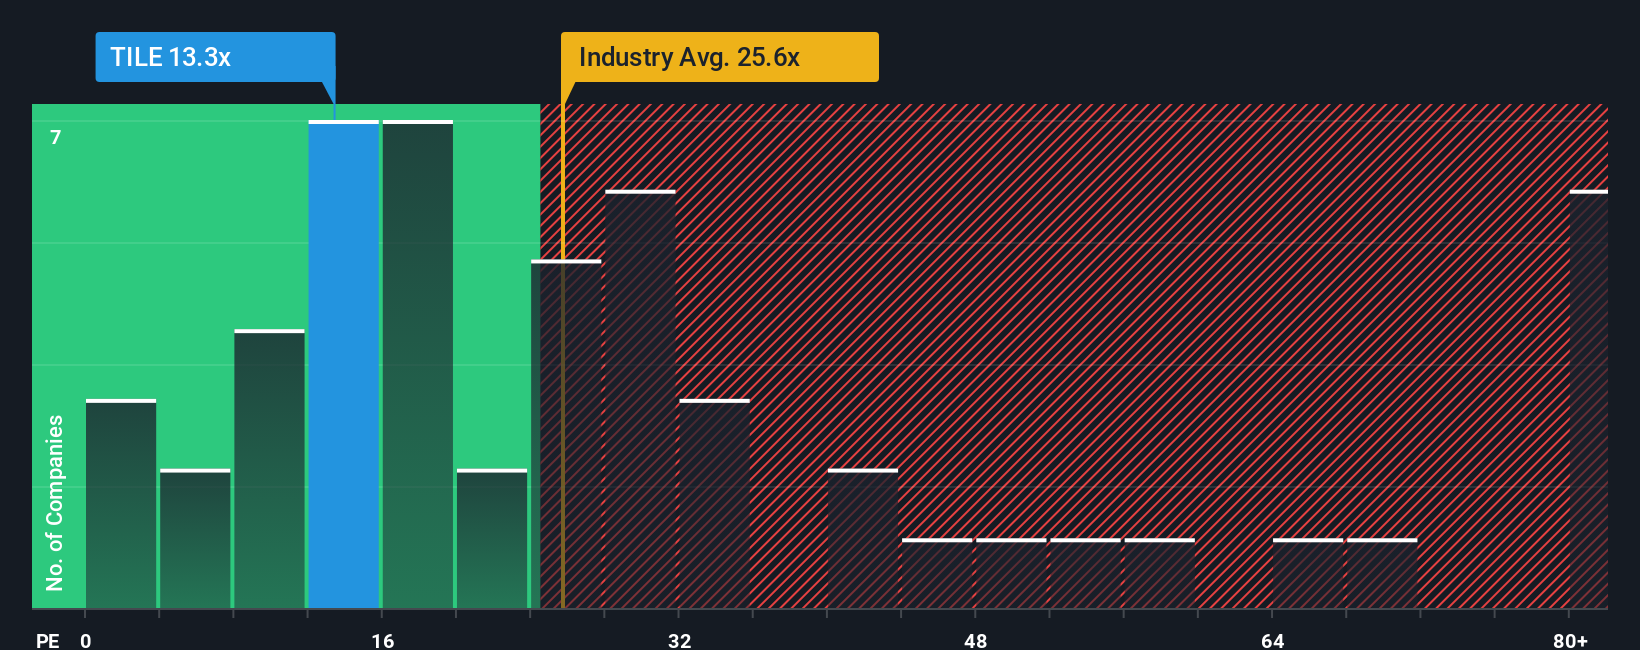
Currently, Interface trades at a PE of 13.3x. This is well below both the industry average of 22.2x and the average for its peers at 18.7x, suggesting it is more modestly valued by the market.
Simply Wall St’s proprietary “Fair Ratio” for Interface is 19.1x. Unlike a basic peer or industry comparison, the Fair Ratio considers unique factors like the company’s earnings growth, risk profile, profit margins, industry trends, and even market capitalization. This method offers a more tailored benchmark for what investors might actually be willing to pay for Interface’s earnings.
Comparing Interface’s current 13.3x PE to its Fair Ratio of 19.1x shows the stock is trading at a notable discount by this approach. This reinforces the idea that it could be undervalued on a relative basis.
Result: UNDERVALUED
PE ratios tell one story, but what if the real opportunity lies elsewhere? Discover 1404 companies where insiders are betting big on explosive growth.
Upgrade Your Decision Making: Choose your Interface Narrative
Earlier we mentioned that there is an even better way to understand valuation, so let's introduce you to Narratives. A Narrative is simply your story for a company, connecting what you believe about its future, such as expected growth, profitability, and business drivers, to the numbers you use for estimating fair value.
Where traditional models crunch numbers, Narratives add meaning. They let you link the real reasons behind a company’s outlook with your financial forecasts and then calculate what you think the business is truly worth. This approach makes investing more personal and logical, showing you not just what a stock is worth, but why.
On Simply Wall St’s Community page, millions of investors use Narratives as an easy, interactive tool to decide whether a stock like Interface is a buy or sell based on their own assumptions. The platform keeps your Narrative up to date, automatically reflecting the latest news or earnings so your view stays relevant.
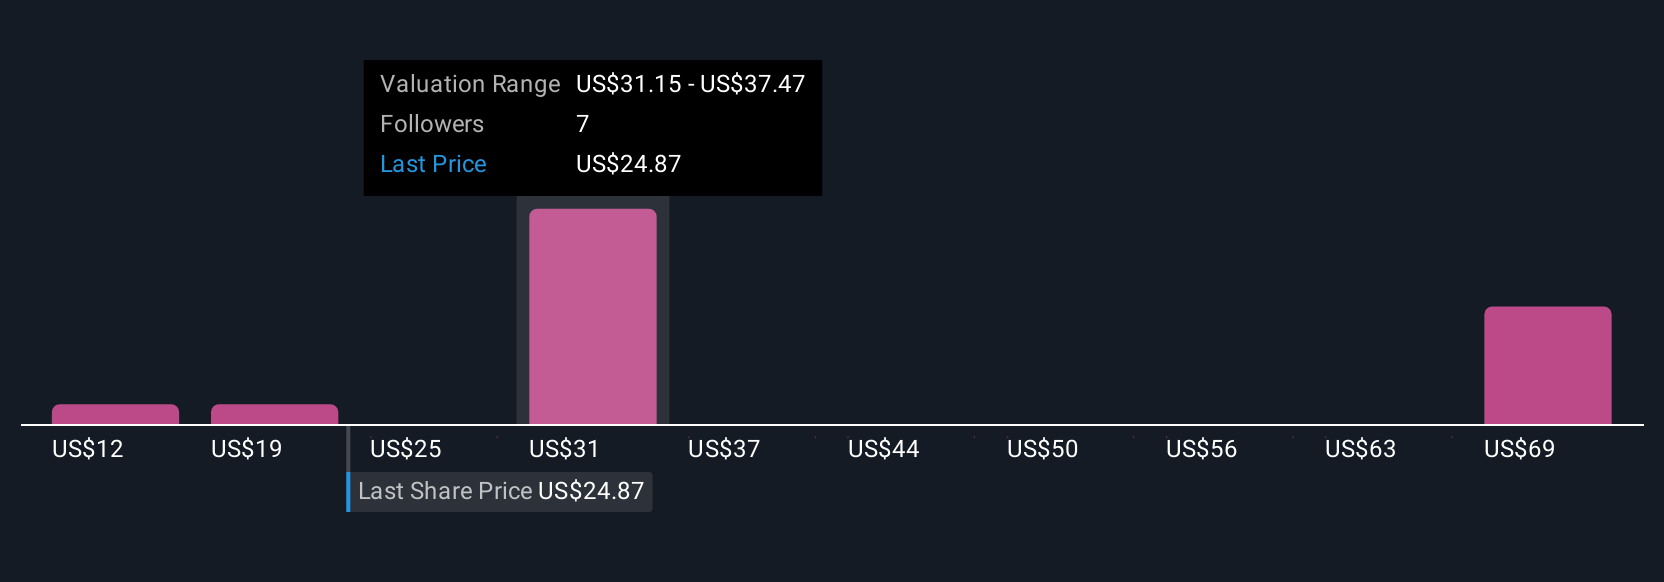
For example, one investor may create a bullish Narrative for Interface, highlighting growth from sustainability and automation and setting a fair value of $36.00 per share, while another may focus on margin risks and market challenges, resulting in a more cautious value of $30.00. Your Narrative bridges your insights with a fair value, helping you take action when price and belief align.
Do you think there's more to the story for Interface? Head over to our Community to see what others are saying!
This article by Simply Wall St is general in nature. We provide commentary based on historical data and analyst forecasts only using an unbiased methodology and our articles are not intended to be financial advice. It does not constitute a recommendation to buy or sell any stock, and does not take account of your objectives, or your financial situation. We aim to bring you long-term focused analysis driven by fundamental data. Note that our analysis may not factor in the latest price-sensitive company announcements or qualitative material. Simply Wall St has no position in any stocks mentioned.
New: AI Stock Screener & Alerts
Our new AI Stock Screener scans the market every day to uncover opportunities.
• Dividend Powerhouses (3%+ Yield)
• Undervalued Small Caps with Insider Buying
• High growth Tech and AI Companies
Or build your own from over 50 metrics.
Have feedback on this article? Concerned about the content? Get in touch with us directly. Alternatively, email editorial-team@simplywallst.com
About NasdaqGS:TILE
Interface
Designs, produces, and sells modular carpet products in the United States, Canada, Latin America, Europe, Africa, Asia, and Australia.
Very undervalued with flawless balance sheet.
Similar Companies
Market Insights

Advertisement
Community Narratives
The "Molecular Pencil": Why Beam's Technology is Built to Win
Fair Value US$65.01|65.4% undervalued
DA
Community Contributor
The silent giant behind virtually every advanced chip powering AI, smartphones, and modern infrastructure.
Fair Value US$310.00|6.1% undervalued
OS
Community Contributor
ADP Stock: Solid Fundamentals, But AI Investments Test Its Margin Resilience
Fair Value US$387.77|34.2% undervalued
YI
Community Contributor
MINISO's fair value is projected at 26.69 with an anticipated PE ratio shift of 20x
Fair Value US$24.03|9.6% undervalued
BE
Community Contributor