
Advertisement
- United States
- /
- Commercial Services
- /
- NasdaqGS:TILE
Introducing Interface (NASDAQ:TILE), The Stock That Dropped 27% In The Last Year

Want to participate in a short research study? Help shape the future of investing tools and you could win a $250 gift card!
Passive investing in an index fund is a good way to ensure your own returns roughly match the overall market. When you buy individual stocks, you can make higher profits, but you also face the risk of under-performance. For example, the Interface, Inc. (NASDAQ:TILE) share price is down 27% in the last year. That falls noticeably short of the market return of around 12%. At least the damage isn't so bad if you look at the last three years, since the stock is down 5.7% in that time. It's down 3.4% in the last seven days.
Check out our latest analysis for Interface
To paraphrase Benjamin Graham: Over the short term the market is a voting machine, but over the long term it's a weighing machine. One flawed but reasonable way to assess how sentiment around a company has changed is to compare the earnings per share (EPS) with the share price.
Unhappily, Interface had to report a 28% decline in EPS over the last year. Remarkably, he share price decline of 27% per year is particularly close to the EPS drop. Given the lower EPS we might have expected investors to lose confidence in the stock, but that doesn't seemed to have happened. Instead, the change in the share price seems to reduction in earnings per share, alone.
The graphic below depicts how EPS has changed over time (unveil the exact values by clicking on the image).
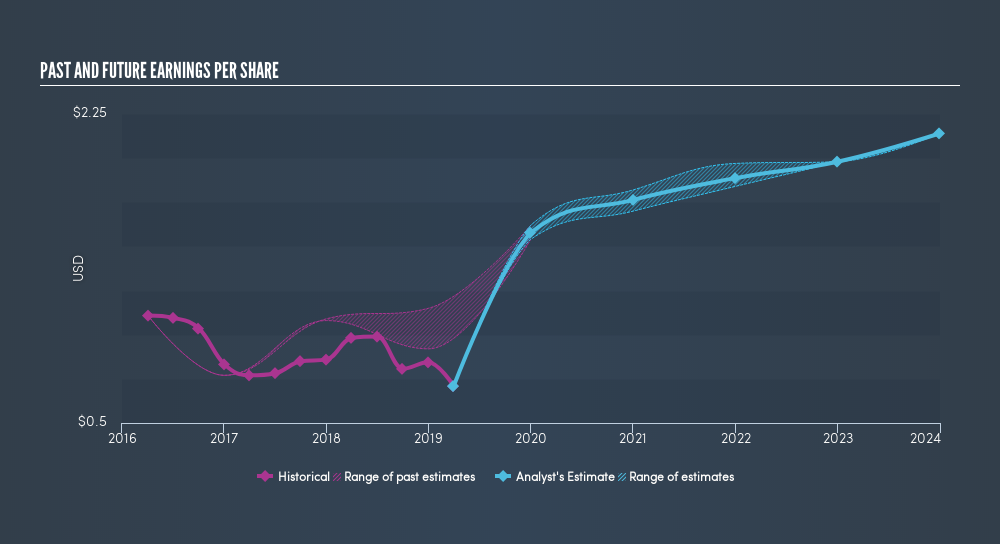
It might be well worthwhile taking a look at our freereport on Interface's earnings, revenue and cash flow.
What about the Total Shareholder Return (TSR)?
Investors should note that there's a difference between Interface's total shareholder return (TSR) and its share price change, which we've covered above. Arguably the TSR is a more complete return calculation because it accounts for the value of dividends (as if they were reinvested), along with the hypothetical value of any discounted capital that have been offered to shareholders. Its history of dividend payouts mean that Interface's TSR, which was a 26% drop over the last year, was not as bad as the share price return.
A Different Perspective
Interface shareholders are down 26% for the year (even including dividends), but the market itself is up 12%. However, keep in mind that even the best stocks will sometimes underperform the market over a twelve month period. Unfortunately, last year's performance may indicate unresolved challenges, given that it was worse than the annualised loss of 1.1% over the last half decade. Generally speaking long term share price weakness can be a bad sign, though contrarian investors might want to research the stock in hope of a turnaround. Before deciding if you like the current share price, check how Interface scores on these 3 valuation metrics.
But note: Interface may not be the best stock to buy. So take a peek at this freelist of interesting companies with past earnings growth (and further growth forecast).
Please note, the market returns quoted in this article reflect the market weighted average returns of stocks that currently trade on US exchanges.We aim to bring you long-term focused research analysis driven by fundamental data. Note that our analysis may not factor in the latest price-sensitive company announcements or qualitative material.
If you spot an error that warrants correction, please contact the editor at editorial-team@simplywallst.com. This article by Simply Wall St is general in nature. It does not constitute a recommendation to buy or sell any stock, and does not take account of your objectives, or your financial situation. Simply Wall St has no position in the stocks mentioned. Thank you for reading.
About NasdaqGS:TILE
Interface
Designs, produces, and sells modular carpet products in the United States, Canada, Latin America, Europe, Africa, Asia, and Australia.
Very undervalued with flawless balance sheet.
Similar Companies
Market Insights

Advertisement
Community Narratives
Vita Life Sciences Set for a 12.72% Revenue Growth While Tackling Operational Challenges
Fair Value AU$2.42|14.9% undervalued
RO
Community Contributor
Vossloh rides a €500 billion wave to boost growth and earnings in the next decade
Fair Value €78.41|4.0% undervalued
CH
Community Contributor
Intuitive Surgical Will Transform Healthcare with 12% Revenue Growth
Fair Value US$325.55|59.4% overvalued
UN
Community Contributor