
Advertisement
- United States
- /
- Commercial Services
- /
- NasdaqCM:SFHG
Samfine Creation Holdings Group Limited's (NASDAQ:SFHG) 26% Dip In Price Shows Sentiment Is Matching Revenues
To the annoyance of some shareholders, Samfine Creation Holdings Group Limited (NASDAQ:SFHG) shares are down a considerable 26% in the last month, which continues a horrid run for the company. For any long-term shareholders, the last month ends a year to forget by locking in a 96% share price decline.
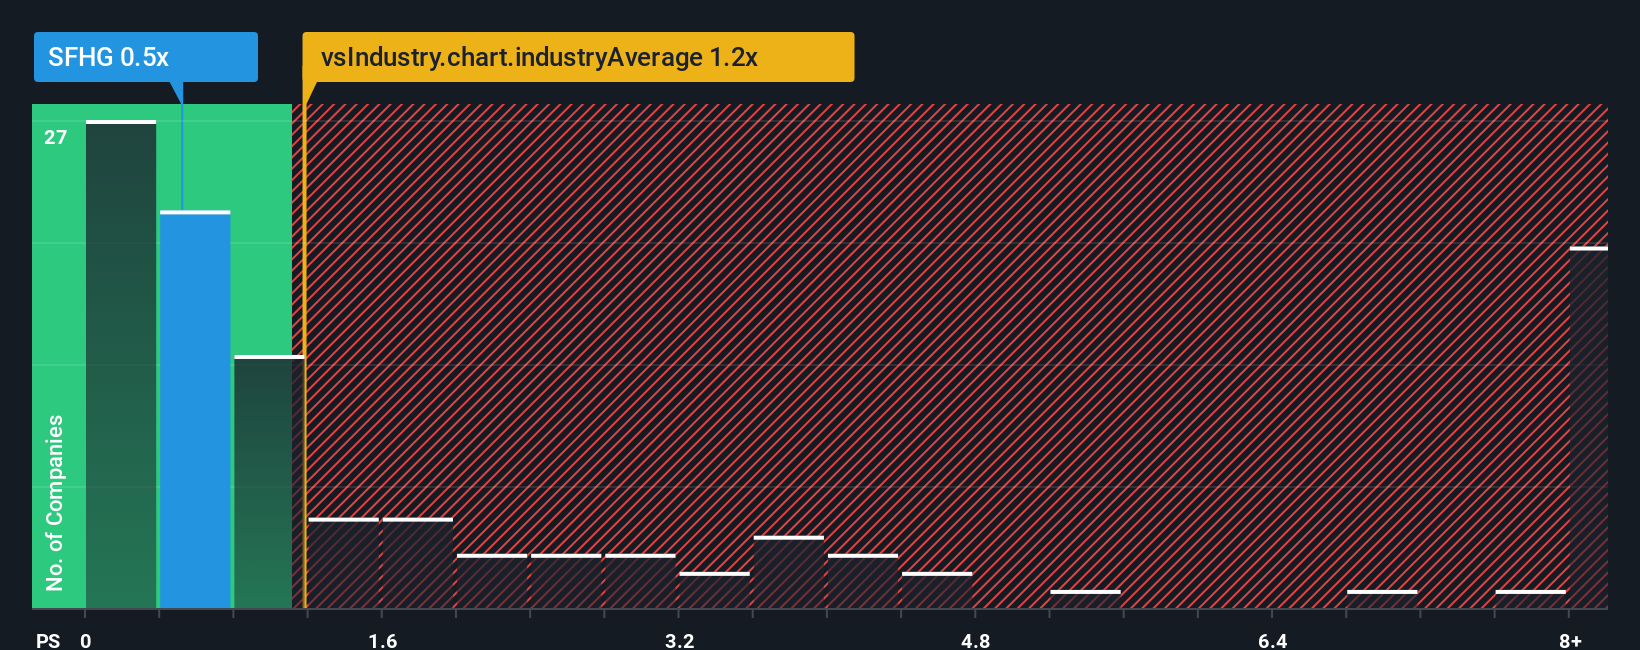
Since its price has dipped substantially, Samfine Creation Holdings Group's price-to-sales (or "P/S") ratio of 0.5x might make it look like a buy right now compared to the Commercial Services industry in the United States, where around half of the companies have P/S ratios above 1.2x and even P/S above 5x are quite common. Although, it's not wise to just take the P/S at face value as there may be an explanation why it's limited.
View our latest analysis for Samfine Creation Holdings Group
What Does Samfine Creation Holdings Group's Recent Performance Look Like?
The recent revenue growth at Samfine Creation Holdings Group would have to be considered satisfactory if not spectacular. One possibility is that the P/S ratio is low because investors think this good revenue growth might actually underperform the broader industry in the near future. Those who are bullish on Samfine Creation Holdings Group will be hoping that this isn't the case, so that they can pick up the stock at a lower valuation.
Want the full picture on earnings, revenue and cash flow for the company? Then our free report on Samfine Creation Holdings Group will help you shine a light on its historical performance.Is There Any Revenue Growth Forecasted For Samfine Creation Holdings Group?
In order to justify its P/S ratio, Samfine Creation Holdings Group would need to produce sluggish growth that's trailing the industry.
Taking a look back first, we see that the company managed to grow revenues by a handy 3.6% last year. However, this wasn't enough as the latest three year period has seen an unpleasant 2.6% overall drop in revenue. Therefore, it's fair to say the revenue growth recently has been undesirable for the company.
Comparing that to the industry, which is predicted to deliver 5.8% growth in the next 12 months, the company's downward momentum based on recent medium-term revenue results is a sobering picture.
With this information, we are not surprised that Samfine Creation Holdings Group is trading at a P/S lower than the industry. However, we think shrinking revenues are unlikely to lead to a stable P/S over the longer term, which could set up shareholders for future disappointment. There's potential for the P/S to fall to even lower levels if the company doesn't improve its top-line growth.
The Final Word
Samfine Creation Holdings Group's P/S has taken a dip along with its share price. Using the price-to-sales ratio alone to determine if you should sell your stock isn't sensible, however it can be a practical guide to the company's future prospects.
Our examination of Samfine Creation Holdings Group confirms that the company's shrinking revenue over the past medium-term is a key factor in its low price-to-sales ratio, given the industry is projected to grow. Right now shareholders are accepting the low P/S as they concede future revenue probably won't provide any pleasant surprises either. Given the current circumstances, it seems unlikely that the share price will experience any significant movement in either direction in the near future if recent medium-term revenue trends persist.
Plus, you should also learn about these 3 warning signs we've spotted with Samfine Creation Holdings Group (including 2 which can't be ignored).
If strong companies turning a profit tickle your fancy, then you'll want to check out this free list of interesting companies that trade on a low P/E (but have proven they can grow earnings).
New: Manage All Your Stock Portfolios in One Place
We've created the ultimate portfolio companion for stock investors, and it's free.
• Connect an unlimited number of Portfolios and see your total in one currency
• Be alerted to new Warning Signs or Risks via email or mobile
• Track the Fair Value of your stocks
Have feedback on this article? Concerned about the content? Get in touch with us directly. Alternatively, email editorial-team (at) simplywallst.com.
This article by Simply Wall St is general in nature. We provide commentary based on historical data and analyst forecasts only using an unbiased methodology and our articles are not intended to be financial advice. It does not constitute a recommendation to buy or sell any stock, and does not take account of your objectives, or your financial situation. We aim to bring you long-term focused analysis driven by fundamental data. Note that our analysis may not factor in the latest price-sensitive company announcements or qualitative material. Simply Wall St has no position in any stocks mentioned.
About NasdaqCM:SFHG
Samfine Creation Holdings Group
Through its subsidiaries, provides printing services in Hong Kong, the People’s Republic of China, the United States, and Europe.
Mediocre balance sheet with low risk.
Market Insights

Advertisement
Community Narratives
The company that turned a verb into a global necessity and basically runs the modern internet, digital ads, smartphones, maps, and AI.
Fair Value US$300.00|5.4% undervalued
OS
Community Contributor
Flowers Foods Pays A Fair Price For Health
Fair Value US$16.12|26.3% undervalued
NV
Community Contributor
TMX Group will thrive with 33.3% profit margin and enduring market moat
Fair Value CA$49.90|4.1% overvalued
LI
Community Contributor
The "Molecular Pencil": Why Beam's Technology is Built to Win
Fair Value US$65.01|62.7% undervalued
DA
Community Contributor