- United States
- /
- Building
- /
- NYSE:SSD
Is Simpson Manufacturing Co., Inc.'s (NYSE:SSD) Recent Stock Performance Tethered To Its Strong Fundamentals?


Simpson Manufacturing's (NYSE:SSD) stock is up by a considerable 12% over the past three months. Given the company's impressive performance, we decided to study its financial indicators more closely as a company's financial health over the long-term usually dictates market outcomes. In this article, we decided to focus on Simpson Manufacturing's ROE.
Return on Equity or ROE is a test of how effectively a company is growing its value and managing investors’ money. In other words, it is a profitability ratio which measures the rate of return on the capital provided by the company's shareholders.
See our latest analysis for Simpson Manufacturing
How Do You Calculate Return On Equity?
Return on equity can be calculated by using the formula:
Return on Equity = Net Profit (from continuing operations) ÷ Shareholders' Equity
So, based on the above formula, the ROE for Simpson Manufacturing is:
19% = US$332m ÷ US$1.8b (Based on the trailing twelve months to June 2024).
The 'return' is the yearly profit. So, this means that for every $1 of its shareholder's investments, the company generates a profit of $0.19.
What Has ROE Got To Do With Earnings Growth?
So far, we've learned that ROE is a measure of a company's profitability. Based on how much of its profits the company chooses to reinvest or "retain", we are then able to evaluate a company's future ability to generate profits. Generally speaking, other things being equal, firms with a high return on equity and profit retention, have a higher growth rate than firms that don’t share these attributes.
Simpson Manufacturing's Earnings Growth And 19% ROE
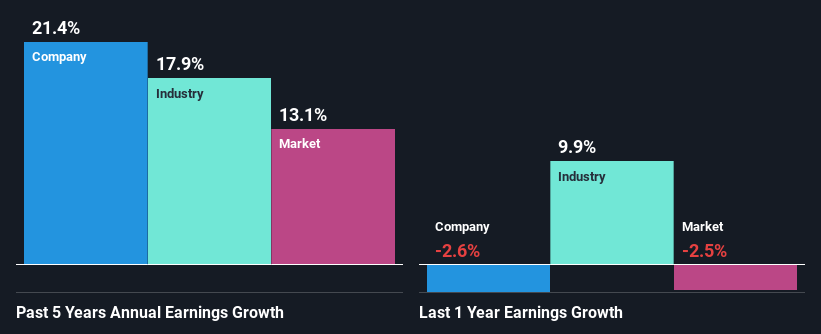
At first glance, Simpson Manufacturing seems to have a decent ROE. And on comparing with the industry, we found that the the average industry ROE is similar at 19%. This certainly adds some context to Simpson Manufacturing's exceptional 21% net income growth seen over the past five years. We believe that there might also be other aspects that are positively influencing the company's earnings growth. For example, it is possible that the company's management has made some good strategic decisions, or that the company has a low payout ratio.
Next, on comparing Simpson Manufacturing's net income growth with the industry, we found that the company's reported growth is similar to the industry average growth rate of 18% over the last few years.
Earnings growth is an important metric to consider when valuing a stock. What investors need to determine next is if the expected earnings growth, or the lack of it, is already built into the share price. By doing so, they will have an idea if the stock is headed into clear blue waters or if swampy waters await. One good indicator of expected earnings growth is the P/E ratio which determines the price the market is willing to pay for a stock based on its earnings prospects. So, you may want to check if Simpson Manufacturing is trading on a high P/E or a low P/E, relative to its industry.
Is Simpson Manufacturing Using Its Retained Earnings Effectively?
Simpson Manufacturing has a really low three-year median payout ratio of 13%, meaning that it has the remaining 87% left over to reinvest into its business. So it looks like Simpson Manufacturing is reinvesting profits heavily to grow its business, which shows in its earnings growth.
Additionally, Simpson Manufacturing has paid dividends over a period of at least ten years which means that the company is pretty serious about sharing its profits with shareholders.
Conclusion
Overall, we are quite pleased with Simpson Manufacturing's performance. Particularly, we like that the company is reinvesting heavily into its business, and at a high rate of return. Unsurprisingly, this has led to an impressive earnings growth. That being so, a study of the latest analyst forecasts show that the company is expected to see a slowdown in its future earnings growth. To know more about the latest analysts predictions for the company, check out this visualization of analyst forecasts for the company.
New: Manage All Your Stock Portfolios in One Place
We've created the ultimate portfolio companion for stock investors, and it's free.
• Connect an unlimited number of Portfolios and see your total in one currency
• Be alerted to new Warning Signs or Risks via email or mobile
• Track the Fair Value of your stocks
Have feedback on this article? Concerned about the content? Get in touch with us directly. Alternatively, email editorial-team (at) simplywallst.com.
This article by Simply Wall St is general in nature. We provide commentary based on historical data and analyst forecasts only using an unbiased methodology and our articles are not intended to be financial advice. It does not constitute a recommendation to buy or sell any stock, and does not take account of your objectives, or your financial situation. We aim to bring you long-term focused analysis driven by fundamental data. Note that our analysis may not factor in the latest price-sensitive company announcements or qualitative material. Simply Wall St has no position in any stocks mentioned.
About NYSE:SSD
Simpson Manufacturing
Through its subsidiaries, designs, engineers, manufactures, and sells structural solutions for wood, concrete, and steel connections.
Excellent balance sheet with questionable track record.

