Advertisement
- United States
- /
- Aerospace & Defense
- /
- NYSE:SPR
Spirit AeroSystems (SPR): Assessing Valuation After Q3 Losses Widen Despite Higher Sales

Simply Wall St
Reviewed by Simply Wall St
Spirit AeroSystems Holdings (SPR) has drawn attention after its latest third-quarter earnings report. Sales ticked higher year over year, but a significantly larger net loss highlights ongoing financial hurdles for the company.
See our latest analysis for Spirit AeroSystems Holdings.
After reporting a steeper net loss along with modest revenue growth, Spirit AeroSystems Holdings’ share price has dipped over the past month and quarter, reflecting investor caution as supply-chain headwinds linger for key partners like Airbus. Still, with a 9.4% year-to-date share price return and a solid 11.5% total shareholder return for the past year, the stock’s long-term momentum remains intact despite some near-term volatility.
If the aerospace sector’s recent turbulence has your attention, consider exploring other opportunities with our curated See the full list for free..
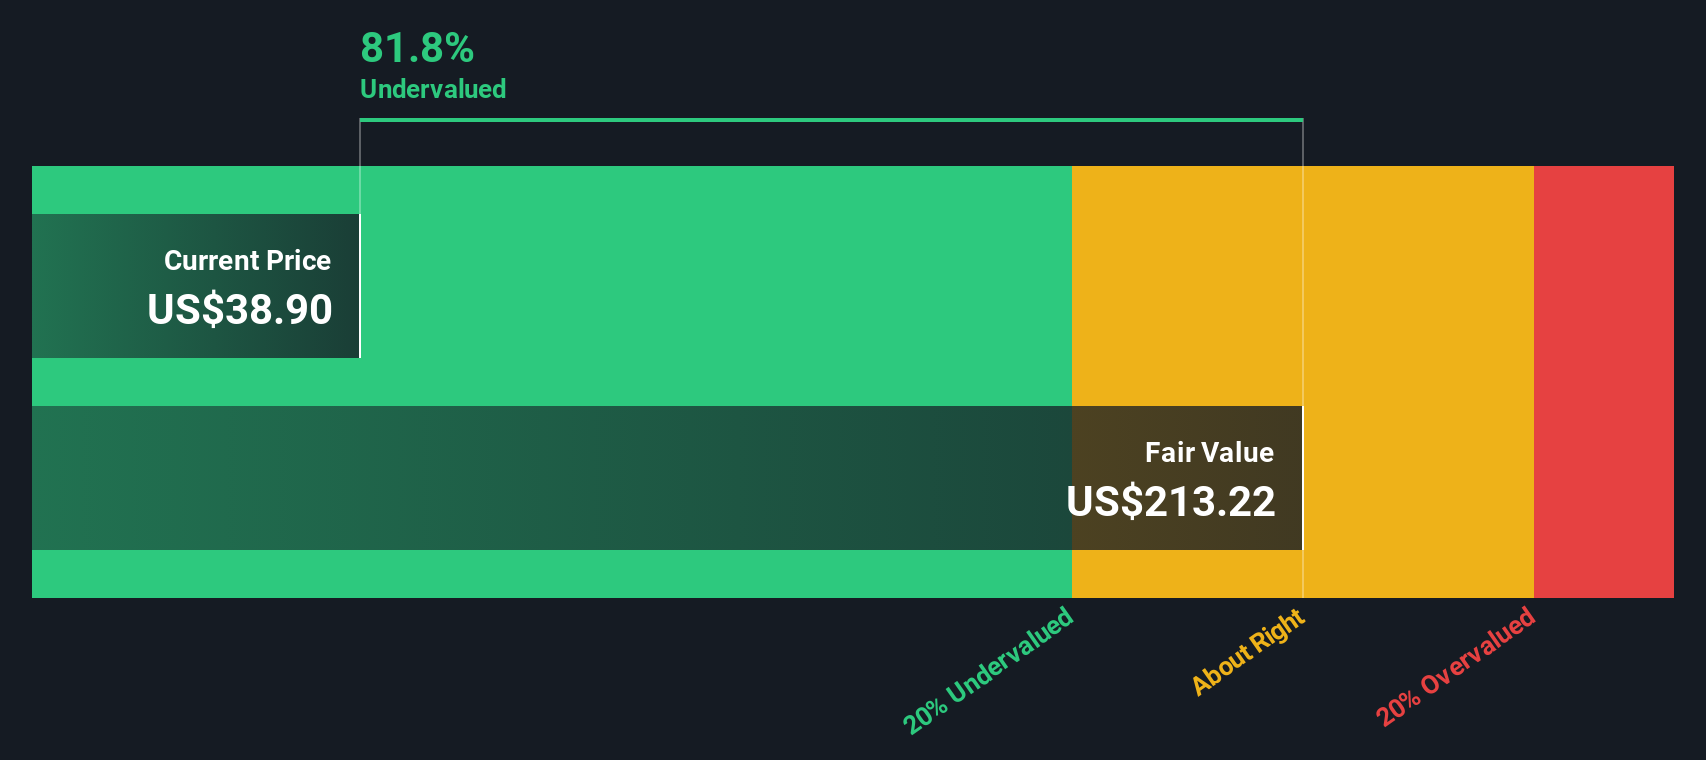
With recent earnings revealing both resilient revenue growth and a widening net loss, investors are left wondering: is Spirit AeroSystems now trading below its true worth, or is the market already factoring in all future growth potential?
Price-to-Sales Ratio of 0.7x: Is it justified?
Compared to its last close of $36.69, Spirit AeroSystems’ price-to-sales ratio stands out as exceptionally low. This signals that investors are currently pricing the stock much cheaper than its US Aerospace & Defense peers.
The price-to-sales (P/S) ratio measures how much investors are willing to pay for each dollar of company revenue. For Spirit AeroSystems, a P/S ratio of 0.7x suggests the stock is trading at well below its sector’s average. This could indicate the market is overlooking future revenue potential, or it may be pricing in heavy risks tied to ongoing losses.
Relative to the industry average P/S of 3x, Spirit AeroSystems appears significantly discounted. However, compared with the estimated fair P/S ratio of 0.4x for the stock, the current valuation may still overstate its financial quality and future prospects. The gap between the actual and fair ratio could be an important signal for where market sentiment might head next.
Explore the SWS fair ratio for Spirit AeroSystems Holdings
Result: Price-to-Sales Ratio of 0.7x (UNDERVALUED)
However, persistent net losses and ongoing supply chain uncertainties could affect Spirit AeroSystems’ recovery and dampen investor enthusiasm in the short term.
Find out about the key risks to this Spirit AeroSystems Holdings narrative.
Another View: Discounted Cash Flow Analysis
Looking at Spirit AeroSystems through the lens of our DCF model tells a very different story. The SWS DCF model estimates fair value at $249.71 per share. The current price sits 85% below this level, which points strongly to undervaluation based on long-term cash flows.
Look into how the SWS DCF model arrives at its fair value.
Simply Wall St performs a discounted cash flow (DCF) on every stock in the world every day (check out Spirit AeroSystems Holdings for example). We show the entire calculation in full. You can track the result in your watchlist or portfolio and be alerted when this changes, or use our stock screener to discover 832 undervalued stocks based on their cash flows. If you save a screener we even alert you when new companies match - so you never miss a potential opportunity.
Build Your Own Spirit AeroSystems Holdings Narrative
If you want to see things from a different angle or prefer to interpret the data on your own terms, you can quickly build your own perspective in just a few minutes, and Do it your way.
A great starting point for your Spirit AeroSystems Holdings research is our analysis highlighting 2 key rewards and 2 important warning signs that could impact your investment decision.
Looking for More Investment Ideas?
Don’t wait for opportunity to pass you by. Seize your edge in the market by checking out these smart, targeted screens below and widen your investment universe today.
- Capture the income advantage with these 22 dividend stocks with yields > 3% offering consistent yields over 3% and strong financials to back them up.
- Spot tomorrow’s tech giants by tapping into these 26 AI penny stocks and ride the momentum of artificial intelligence-driven innovation in the market.
- Step ahead of the crowd by browsing these 832 undervalued stocks based on cash flows that the market may be sleeping on, each priced below their projected cash flow value.
This article by Simply Wall St is general in nature. We provide commentary based on historical data and analyst forecasts only using an unbiased methodology and our articles are not intended to be financial advice. It does not constitute a recommendation to buy or sell any stock, and does not take account of your objectives, or your financial situation. We aim to bring you long-term focused analysis driven by fundamental data. Note that our analysis may not factor in the latest price-sensitive company announcements or qualitative material. Simply Wall St has no position in any stocks mentioned.
New: Manage All Your Stock Portfolios in One Place
We've created the ultimate portfolio companion for stock investors, and it's free.
• Connect an unlimited number of Portfolios and see your total in one currency
• Be alerted to new Warning Signs or Risks via email or mobile
• Track the Fair Value of your stocks
Have feedback on this article? Concerned about the content? Get in touch with us directly. Alternatively, email editorial-team@simplywallst.com
About NYSE:SPR
Spirit AeroSystems Holdings
Engages in the design, engineering, manufacture, and marketing of commercial aerostructures worldwide.
Good value with reasonable growth potential.
Similar Companies
Market Insights

Advertisement
Community Narratives
The company that turned a verb into a global necessity and basically runs the modern internet, digital ads, smartphones, maps, and AI.
Fair Value US$300.00|6.3% undervalued
OS
Community Contributor
Flowers Foods Pays A Fair Price For Health
Fair Value US$16.12|26.0% undervalued
NV
Community Contributor
TMX Group will thrive with 33.3% profit margin and enduring market moat
Fair Value CA$49.90|3.7% overvalued
LI
Community Contributor