- United States
- /
- Machinery
- /
- NYSE:SNA
Snap-on Incorporated (NYSE:SNA) Stock Has Shown Weakness Lately But Financials Look Strong: Should Prospective Shareholders Make The Leap?


It is hard to get excited after looking at Snap-on's (NYSE:SNA) recent performance, when its stock has declined 10% over the past three months. However, a closer look at its sound financials might cause you to think again. Given that fundamentals usually drive long-term market outcomes, the company is worth looking at. In this article, we decided to focus on Snap-on's ROE.
Return on equity or ROE is an important factor to be considered by a shareholder because it tells them how effectively their capital is being reinvested. In simpler terms, it measures the profitability of a company in relation to shareholder's equity.
See our latest analysis for Snap-on
How Is ROE Calculated?
The formula for ROE is:
Return on Equity = Net Profit (from continuing operations) ÷ Shareholders' Equity
So, based on the above formula, the ROE for Snap-on is:
20% = US$1.0b ÷ US$5.2b (Based on the trailing twelve months to March 2024).
The 'return' is the profit over the last twelve months. So, this means that for every $1 of its shareholder's investments, the company generates a profit of $0.20.
What Is The Relationship Between ROE And Earnings Growth?
Thus far, we have learned that ROE measures how efficiently a company is generating its profits. Based on how much of its profits the company chooses to reinvest or "retain", we are then able to evaluate a company's future ability to generate profits. Assuming everything else remains unchanged, the higher the ROE and profit retention, the higher the growth rate of a company compared to companies that don't necessarily bear these characteristics.
Snap-on's Earnings Growth And 20% ROE
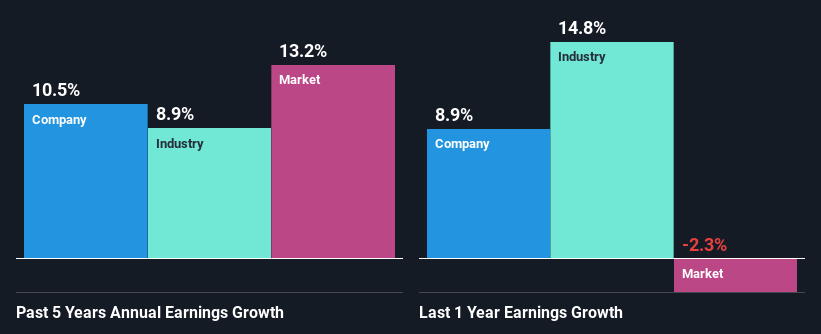
To begin with, Snap-on seems to have a respectable ROE. On comparing with the average industry ROE of 14% the company's ROE looks pretty remarkable. This probably laid the ground for Snap-on's moderate 11% net income growth seen over the past five years.
We then performed a comparison between Snap-on's net income growth with the industry, which revealed that the company's growth is similar to the average industry growth of 8.9% in the same 5-year period.
Earnings growth is an important metric to consider when valuing a stock. It’s important for an investor to know whether the market has priced in the company's expected earnings growth (or decline). This then helps them determine if the stock is placed for a bright or bleak future. What is SNA worth today? The intrinsic value infographic in our free research report helps visualize whether SNA is currently mispriced by the market.
Is Snap-on Making Efficient Use Of Its Profits?
Snap-on has a healthy combination of a moderate three-year median payout ratio of 34% (or a retention ratio of 66%) and a respectable amount of growth in earnings as we saw above, meaning that the company has been making efficient use of its profits.
Moreover, Snap-on is determined to keep sharing its profits with shareholders which we infer from its long history of paying a dividend for at least ten years. Our latest analyst data shows that the future payout ratio of the company over the next three years is expected to be approximately 39%. Accordingly, forecasts suggest that Snap-on's future ROE will be 19% which is again, similar to the current ROE.
Summary
On the whole, we feel that Snap-on's performance has been quite good. Particularly, we like that the company is reinvesting heavily into its business, and at a high rate of return. Unsurprisingly, this has led to an impressive earnings growth. Having said that, the company's earnings growth is expected to slow down, as forecasted in the current analyst estimates. To know more about the company's future earnings growth forecasts take a look at this free report on analyst forecasts for the company to find out more.
New: Manage All Your Stock Portfolios in One Place
We've created the ultimate portfolio companion for stock investors, and it's free.
• Connect an unlimited number of Portfolios and see your total in one currency
• Be alerted to new Warning Signs or Risks via email or mobile
• Track the Fair Value of your stocks
Have feedback on this article? Concerned about the content? Get in touch with us directly. Alternatively, email editorial-team (at) simplywallst.com.
This article by Simply Wall St is general in nature. We provide commentary based on historical data and analyst forecasts only using an unbiased methodology and our articles are not intended to be financial advice. It does not constitute a recommendation to buy or sell any stock, and does not take account of your objectives, or your financial situation. We aim to bring you long-term focused analysis driven by fundamental data. Note that our analysis may not factor in the latest price-sensitive company announcements or qualitative material. Simply Wall St has no position in any stocks mentioned.
Have feedback on this article? Concerned about the content? Get in touch with us directly. Alternatively, email editorial-team@simplywallst.com
About NYSE:SNA
Snap-on
Manufactures and markets tools, equipment, diagnostics, and repair information and systems solutions for professional users worldwide.
Flawless balance sheet, undervalued and pays a dividend.
