Advertisement
- United States
- /
- Trade Distributors
- /
- NYSE:NPKI
Does NPK International’s Partnership Signal Stronger Potential After Its 81% Price Rally?

Simply Wall St
Reviewed by Bailey Pemberton
- Wondering if NPK International is actually a bargain or just riding market hype? You’re not alone, and we’re about to dig into the numbers together.
- The stock has delivered an impressive 63.9% gain so far this year, with a substantial 80.9% return over the past 12 months. However, the last week saw a slight dip of 4.7%.
- Just last month, NPK International made headlines by announcing a strategic partnership aimed at expanding into new international markets. Many observers believe this move is fueling its recent strong upward momentum.
- On the valuation front, NPK International scores just 1 out of 6 on our undervaluation checks. While we’ll break down the usual metrics, keep reading for a fresh perspective on how to really judge value.
NPK International scores just 1/6 on our valuation checks. See what other red flags we found in the full valuation breakdown.
Approach 1: NPK International Discounted Cash Flow (DCF) Analysis
The Discounted Cash Flow (DCF) model estimates a company's intrinsic value by projecting its future cash flows and discounting them back to today's value. This helps investors assess whether a stock is under or overvalued based on expected future performance.
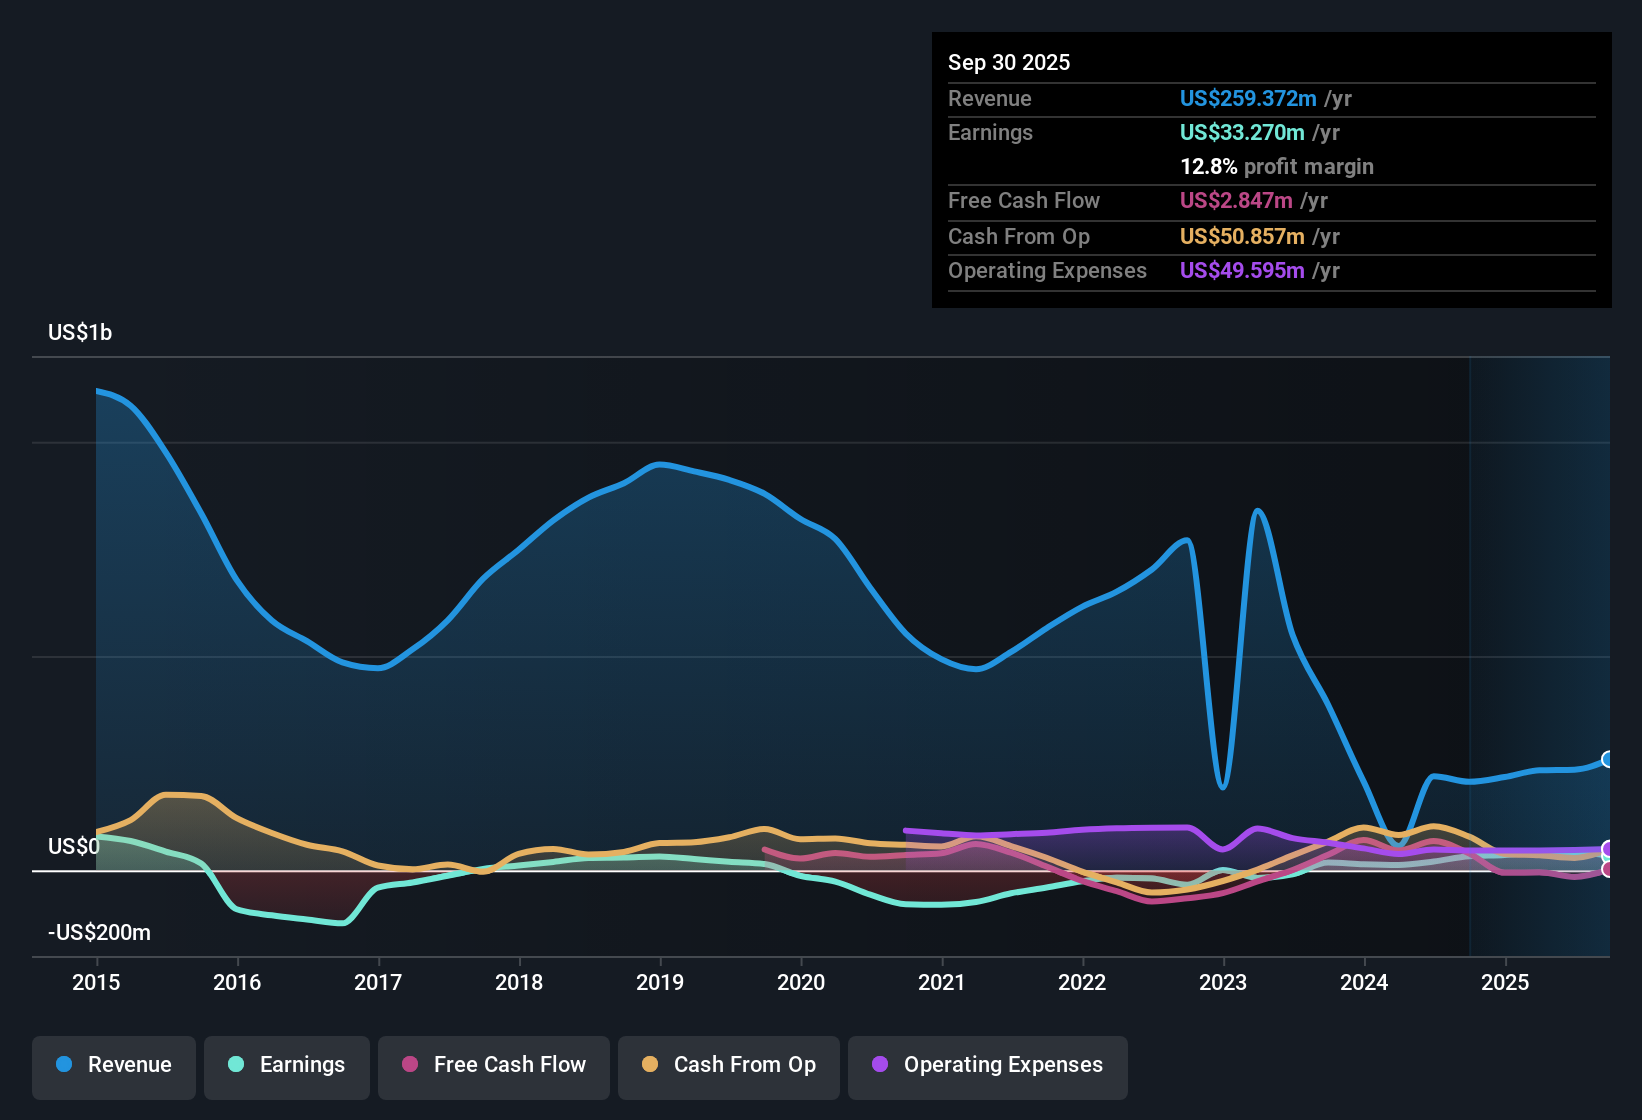
For NPK International, the DCF analysis is based on a 2 Stage Free Cash Flow to Equity approach. Currently, the company's Free Cash Flow stands at $15.0 Million. Projections show that free cash flow is expected to grow in the near term, with analyst estimates reaching up to $25.5 Million by the end of 2024. Beyond the next five years, these forecasts are extrapolated by Simply Wall St. By 2035, projected Free Cash Flow slows to around $964,000 according to these long-range estimates.
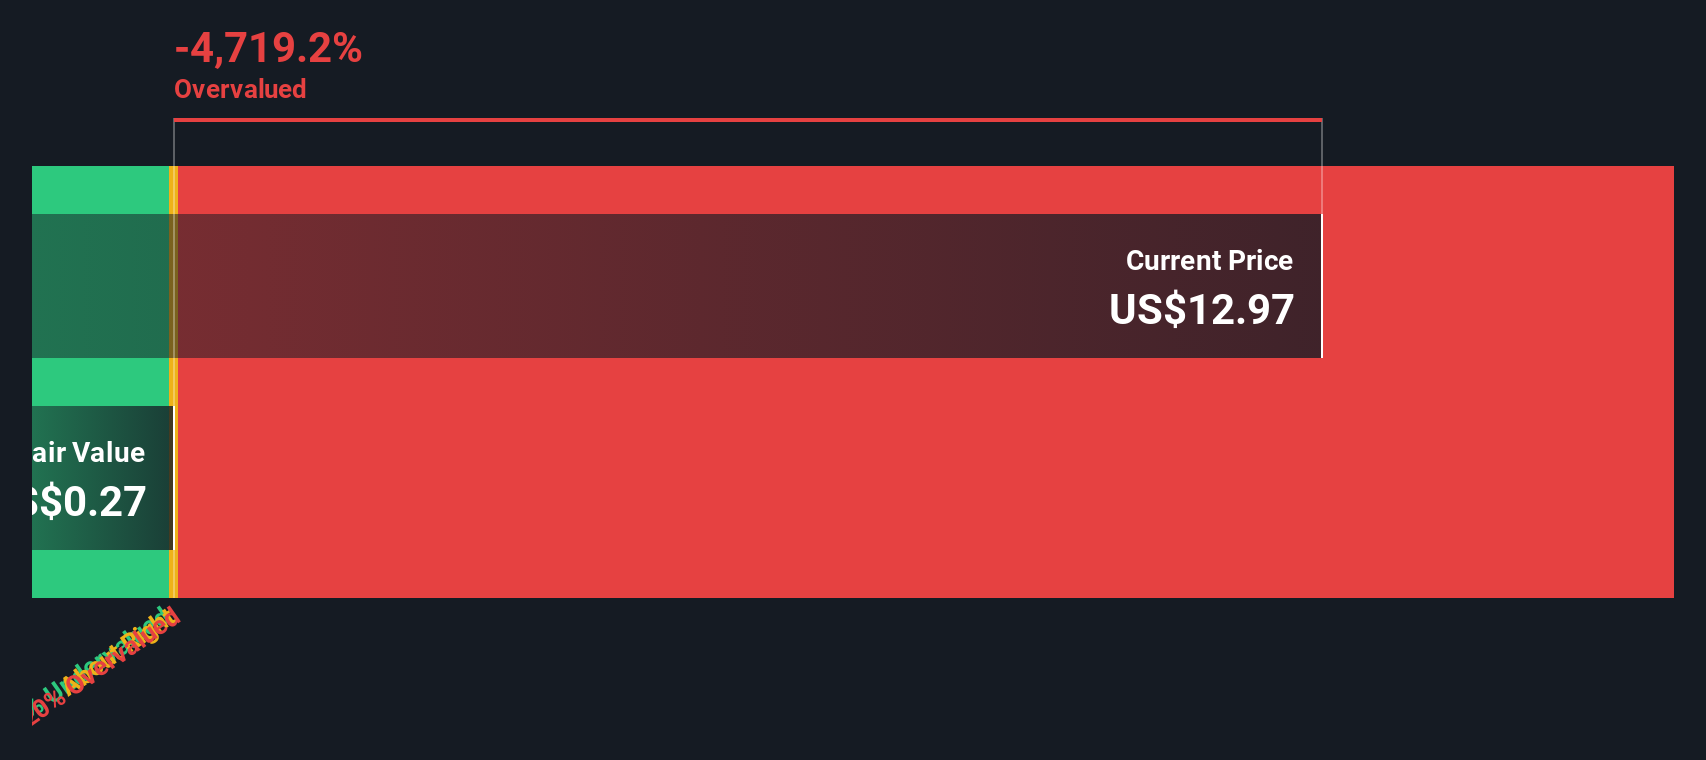
After discounting all future expected cash flows to their present value, the estimated intrinsic value per share is $0.27. Right now, the stock trades at a level 4557.2% above this calculated fair value, suggesting the market is pricing in much more optimism than the DCF model supports.
In summary, the DCF analysis paints a clear picture: NPK International currently appears massively overvalued compared to its future cash flow fundamentals.
Result: OVERVALUED
Our Discounted Cash Flow (DCF) analysis suggests NPK International may be overvalued by 4557.2%. Discover 840 undervalued stocks or create your own screener to find better value opportunities.
Approach 2: NPK International Price vs Earnings
For profitable companies like NPK International, the Price-to-Earnings (PE) ratio is a widely accepted and intuitive valuation tool. The PE ratio gives investors a sense of how much they are paying for each dollar of earnings and is particularly useful for comparing companies within the same sector that generate steady profits.
Market expectations for growth and risk play a big role in shaping what is considered a “normal” or “fair” PE ratio. Higher growth prospects and lower perceived risks typically justify a higher PE. Conversely, slower growth or riskier companies generally trade at lower PE ratios.
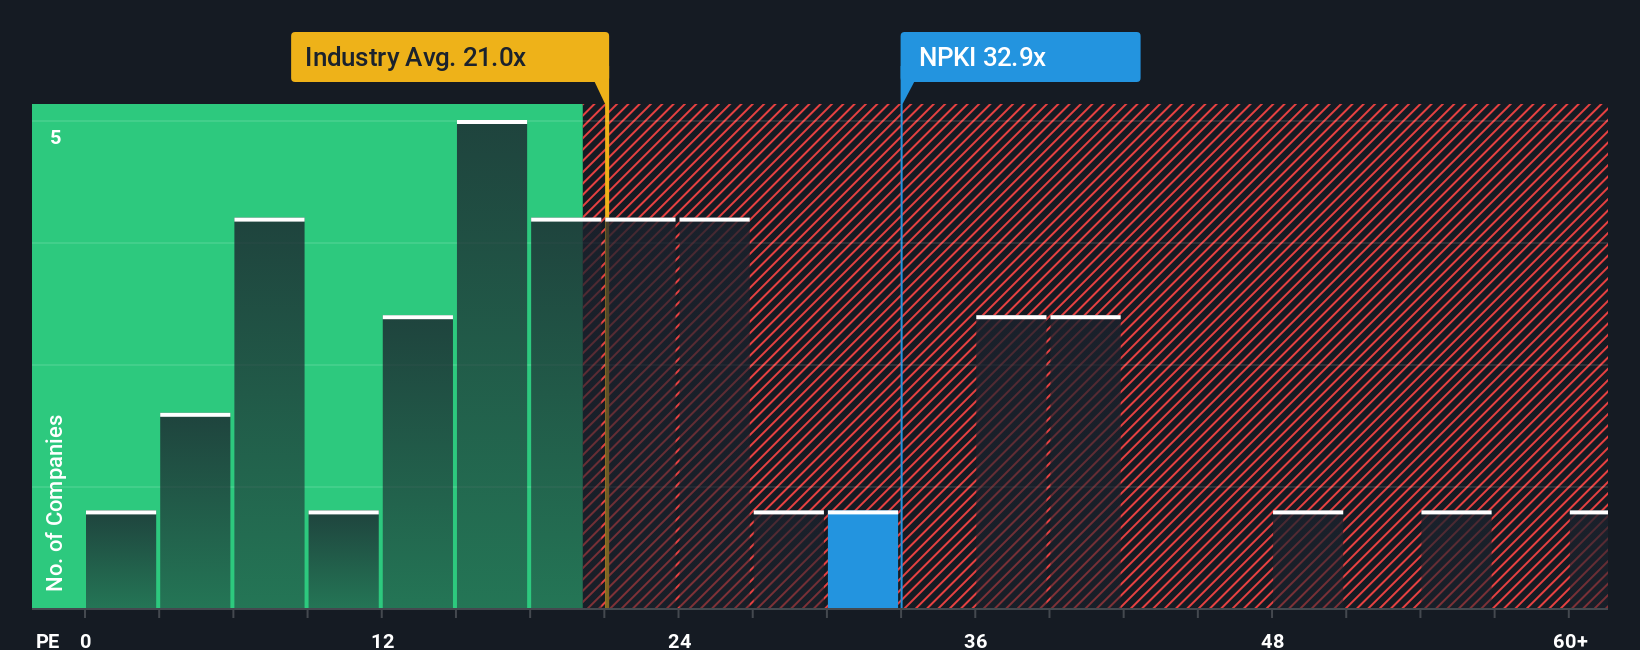
NPK International is currently trading at a PE ratio of 31.8x. To put that figure into perspective, the Trade Distributors industry averages a PE of 20.9x, and the company's close peers trade around 22.4x. This suggests that the market is pricing in significantly brighter prospects or lower risk for NPK International compared to both peers and the broader industry.
Simply Wall St’s proprietary “Fair Ratio” provides a deeper analysis. Unlike simple peer or industry comparisons, the Fair Ratio examines factors such as the company’s earnings growth, profit margins, risk profile, industry dynamics, and market cap to produce a more nuanced benchmark. In this case, NPK International’s Fair PE Ratio is 26.7x, reflecting its specific risk-return profile and prospects within its sector.
Comparing this Fair Ratio to the company’s actual PE shows that the stock’s multiple is higher than both the fair and industry benchmarks. This indicates it is trading at a premium that may be difficult to justify based on current fundamentals and outlook.
Result: OVERVALUED
PE ratios tell one story, but what if the real opportunity lies elsewhere? Discover 1411 companies where insiders are betting big on explosive growth.
Upgrade Your Decision Making: Choose your NPK International Narrative
Earlier we mentioned that there's an even better way to understand valuation, so let's introduce you to Narratives.
Narratives are an intuitive tool that lets investors craft and share their own story about a company, not just by crunching the numbers but by setting assumptions for things like future revenue, earnings, margins, and ultimately fair value. This connects "the company’s story" directly to its financial forecasts.
Available to millions of investors on Simply Wall St’s Community page, Narratives make it easy to see how your outlook lines up with others, or to explore multiple scenarios side by side.
By comparing the Fair Value in your Narrative to the current Price, you can figure out when to act. For example, you might consider buying when your projected value is higher, or selling if it’s lower, helping you move beyond static ratios and react as the story changes.
Because Narratives are updated automatically with new earnings or headlines, your view always reflects the latest information.
For example, some investors see NPK International’s expanding infrastructure contracts and product innovation justifying a $14.00 price target, while others worry about rising costs and market risks and set their fair value closer to $12.00. This means you can instantly sense-check your own perspective with those from across the market.
Do you think there's more to the story for NPK International? Head over to our Community to see what others are saying!
This article by Simply Wall St is general in nature. We provide commentary based on historical data and analyst forecasts only using an unbiased methodology and our articles are not intended to be financial advice. It does not constitute a recommendation to buy or sell any stock, and does not take account of your objectives, or your financial situation. We aim to bring you long-term focused analysis driven by fundamental data. Note that our analysis may not factor in the latest price-sensitive company announcements or qualitative material. Simply Wall St has no position in any stocks mentioned.
Valuation is complex, but we're here to simplify it.
Discover if NPK International might be undervalued or overvalued with our detailed analysis, featuring fair value estimates, potential risks, dividends, insider trades, and its financial condition.
Access Free AnalysisHave feedback on this article? Concerned about the content? Get in touch with us directly. Alternatively, email editorial-team@simplywallst.com
About NYSE:NPKI
NPK International
A temporary worksite access solutions company, manufactures, sells, and rents recyclable composite matting products.
Flawless balance sheet with moderate growth potential.
Similar Companies
Market Insights

Advertisement
Community Narratives
The company that turned a verb into a global necessity and basically runs the modern internet, digital ads, smartphones, maps, and AI.
Fair Value US$300.00|7.5% undervalued
OS
Community Contributor
Flowers Foods Pays A Fair Price For Health
Fair Value US$16.12|25.4% undervalued
NV
Community Contributor
TMX Group will thrive with 33.3% profit margin and enduring market moat
Fair Value CA$49.90|3.6% overvalued
LI
Community Contributor
The "Molecular Pencil": Why Beam's Technology is Built to Win
Fair Value US$65.01|65.0% undervalued
DA
Community Contributor