- United States
- /
- Aerospace & Defense
- /
- NYSE:HII
Investing in Huntington Ingalls Industries (NYSE:HII) three years ago would have delivered you a 44% gain


By buying an index fund, investors can approximate the average market return. But if you pick the right individual stocks, you could make more than that. For example, Huntington Ingalls Industries, Inc. (NYSE:HII) shareholders have seen the share price rise 35% over three years, well in excess of the market return (22%, not including dividends). However, more recent returns haven't been as impressive as that, with the stock returning just 30% in the last year, including dividends.
Let's take a look at the underlying fundamentals over the longer term, and see if they've been consistent with shareholders returns.
View our latest analysis for Huntington Ingalls Industries
While markets are a powerful pricing mechanism, share prices reflect investor sentiment, not just underlying business performance. By comparing earnings per share (EPS) and share price changes over time, we can get a feel for how investor attitudes to a company have morphed over time.
During three years of share price growth, Huntington Ingalls Industries achieved compound earnings per share growth of 1.0% per year. In comparison, the 10% per year gain in the share price outpaces the EPS growth. This suggests that, as the business progressed over the last few years, it gained the confidence of market participants. It's not unusual to see the market 're-rate' a stock, after a few years of growth.
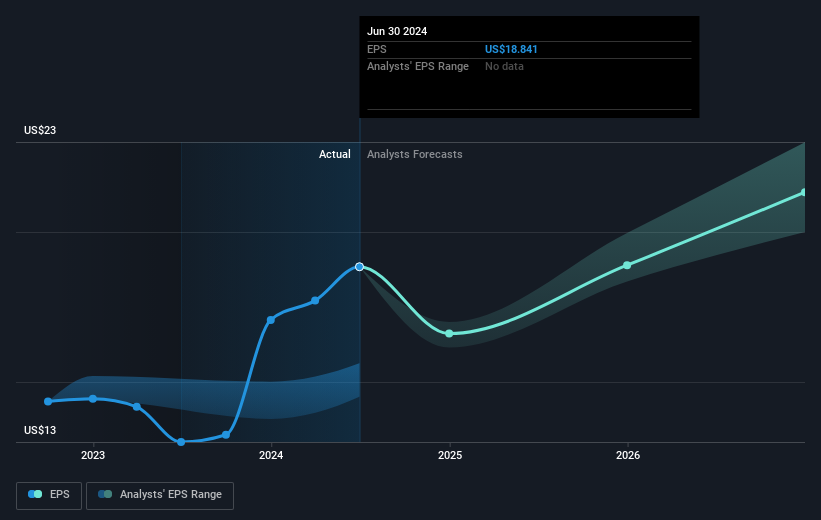
The company's earnings per share (over time) is depicted in the image below (click to see the exact numbers).
We know that Huntington Ingalls Industries has improved its bottom line lately, but is it going to grow revenue? Check if analysts think Huntington Ingalls Industries will grow revenue in the future.
What About Dividends?
When looking at investment returns, it is important to consider the difference between total shareholder return (TSR) and share price return. The TSR incorporates the value of any spin-offs or discounted capital raisings, along with any dividends, based on the assumption that the dividends are reinvested. So for companies that pay a generous dividend, the TSR is often a lot higher than the share price return. In the case of Huntington Ingalls Industries, it has a TSR of 44% for the last 3 years. That exceeds its share price return that we previously mentioned. And there's no prize for guessing that the dividend payments largely explain the divergence!
A Different Perspective
Huntington Ingalls Industries shareholders gained a total return of 30% during the year. Unfortunately this falls short of the market return. The silver lining is that the gain was actually better than the average annual return of 7% per year over five year. This could indicate that the company is winning over new investors, as it pursues its strategy. I find it very interesting to look at share price over the long term as a proxy for business performance. But to truly gain insight, we need to consider other information, too. Take risks, for example - Huntington Ingalls Industries has 1 warning sign we think you should be aware of.
But note: Huntington Ingalls Industries may not be the best stock to buy. So take a peek at this free list of interesting companies with past earnings growth (and further growth forecast).
Please note, the market returns quoted in this article reflect the market weighted average returns of stocks that currently trade on American exchanges.
Valuation is complex, but we're here to simplify it.
Discover if Huntington Ingalls Industries might be undervalued or overvalued with our detailed analysis, featuring fair value estimates, potential risks, dividends, insider trades, and its financial condition.
Access Free AnalysisHave feedback on this article? Concerned about the content? Get in touch with us directly. Alternatively, email editorial-team (at) simplywallst.com.
This article by Simply Wall St is general in nature. We provide commentary based on historical data and analyst forecasts only using an unbiased methodology and our articles are not intended to be financial advice. It does not constitute a recommendation to buy or sell any stock, and does not take account of your objectives, or your financial situation. We aim to bring you long-term focused analysis driven by fundamental data. Note that our analysis may not factor in the latest price-sensitive company announcements or qualitative material. Simply Wall St has no position in any stocks mentioned.
About NYSE:HII
Huntington Ingalls Industries
Designs, builds, overhauls, and repairs military ships in the United States.
Undervalued with solid track record and pays a dividend.

