Advertisement
- United States
- /
- Machinery
- /
- NYSE:GTLS
Will Chart Industries' (GTLS) Shift to a Third Quarter Net Loss Reshape Its Investment Narrative?

Simply Wall St
Reviewed by Sasha Jovanovic
- Chart Industries reported its third quarter 2025 earnings on October 29, 2025, showing sales of US$1.10 billion but moving from net income of US$69 million to a net loss of US$138.5 million compared to the same period last year.
- Despite higher revenues, the company's earnings update revealed a shift to losses, with losses per share replacing the previous year's profits.
- We'll explore how the shift from profit to net loss may shape the outlook for Chart Industries' investment narrative.
Outshine the giants: these 24 early-stage AI stocks could fund your retirement.
Chart Industries Investment Narrative Recap
To be a Chart Industries shareholder, you need to believe in the company's ability to convert strong sales and high order volumes in LNG, hydrogen, and clean energy markets into consistent profitability. The latest earnings report revealed a significant swing to a net loss despite higher revenues, which brings short-term attention to whether management can effectively control costs and protect margins; this news event materially heightens the focus on the company's near-term profitability risk, while the main catalyst, order backlog fulfillment, remains intact but under closer scrutiny.
Among the latest announcements, the absence of share repurchases in the third quarter stands out in relation to this earnings miss. It signals that Chart Industries may be prioritizing liquidity and balance sheet strength given the recent net losses, which connects directly to concerns about managing free cash flow and meeting net debt reduction targets as previously flagged.
On the other hand, investors should be aware that a single large one-off loss could be masking...
Read the full narrative on Chart Industries (it's free!)
Chart Industries' outlook anticipates $5.5 billion in revenue and $740.1 million in earnings by 2028. This is based on a 9.2% annual revenue growth rate and an increase in earnings of about $490 million from the current $250.1 million.
Uncover how Chart Industries' forecasts yield a $206.67 fair value, a 3% upside to its current price.
Exploring Other Perspectives
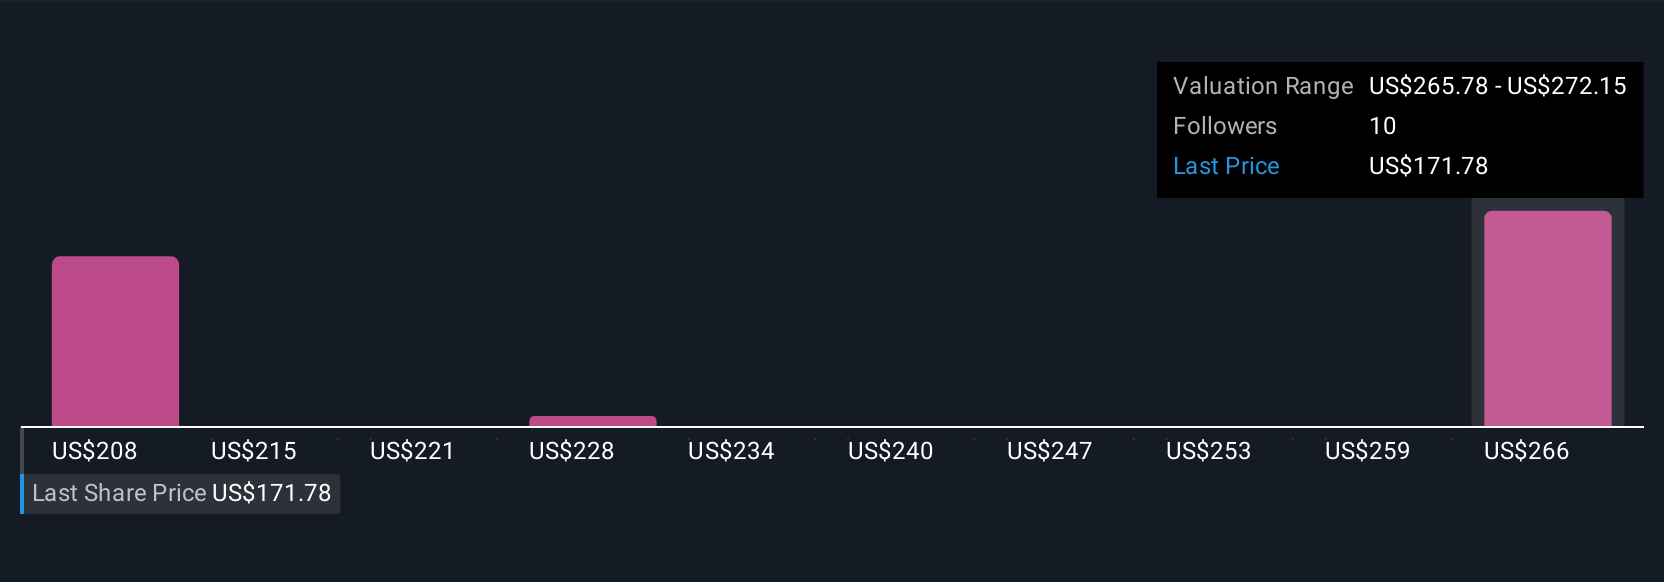
Three members of the Simply Wall St Community placed their fair value estimates between US$206,667 and US$247,356 per share. Against this spectrum of opinions, persistent risks around margin pressure and liquidity could shape your view on Chart Industries’ ability to rebound, so compare several perspectives before making up your mind.
Explore 3 other fair value estimates on Chart Industries - why the stock might be worth as much as 23% more than the current price!
Build Your Own Chart Industries Narrative
Disagree with existing narratives? Create your own in under 3 minutes - extraordinary investment returns rarely come from following the herd.
- A great starting point for your Chart Industries research is our analysis highlighting 2 key rewards and 3 important warning signs that could impact your investment decision.
- Our free Chart Industries research report provides a comprehensive fundamental analysis summarized in a single visual - the Snowflake - making it easy to evaluate Chart Industries' overall financial health at a glance.
Ready To Venture Into Other Investment Styles?
The market won't wait. These fast-moving stocks are hot now. Grab the list before they run:
- Find companies with promising cash flow potential yet trading below their fair value.
- The end of cancer? These 29 emerging AI stocks are developing tech that will allow early identification of life changing diseases like cancer and Alzheimer's.
- These 13 companies survived and thrived after COVID and have the right ingredients to survive Trump's tariffs. Discover why before your portfolio feels the trade war pinch.
This article by Simply Wall St is general in nature. We provide commentary based on historical data and analyst forecasts only using an unbiased methodology and our articles are not intended to be financial advice. It does not constitute a recommendation to buy or sell any stock, and does not take account of your objectives, or your financial situation. We aim to bring you long-term focused analysis driven by fundamental data. Note that our analysis may not factor in the latest price-sensitive company announcements or qualitative material. Simply Wall St has no position in any stocks mentioned.
New: AI Stock Screener & Alerts
Our new AI Stock Screener scans the market every day to uncover opportunities.
• Dividend Powerhouses (3%+ Yield)
• Undervalued Small Caps with Insider Buying
• High growth Tech and AI Companies
Or build your own from over 50 metrics.
Have feedback on this article? Concerned about the content? Get in touch with us directly. Alternatively, email editorial-team@simplywallst.com
About NYSE:GTLS
Chart Industries
Engages in the designing, engineering, and manufacturing of process technologies and equipment for the gas and liquid molecules in the United States and internationally.
Fair value with moderate growth potential.
Similar Companies
Market Insights

Advertisement
Community Narratives
The company that turned a verb into a global necessity and basically runs the modern internet, digital ads, smartphones, maps, and AI.
Fair Value US$300.00|7.1% undervalued
OS
Community Contributor
Flowers Foods Pays A Fair Price For Health
Fair Value US$16.12|26.4% undervalued
NV
Community Contributor
TMX Group will thrive with 33.3% profit margin and enduring market moat
Fair Value CA$49.90|0.8% overvalued
LI
Community Contributor
The "Molecular Pencil": Why Beam's Technology is Built to Win
Fair Value US$65.01|65.8% undervalued
DA
Community Contributor