- United States
- /
- Machinery
- /
- NYSE:GTLS
Returns On Capital Signal Tricky Times Ahead For Chart Industries (NYSE:GTLS)


If you're not sure where to start when looking for the next multi-bagger, there are a few key trends you should keep an eye out for. Amongst other things, we'll want to see two things; firstly, a growing return on capital employed (ROCE) and secondly, an expansion in the company's amount of capital employed. Ultimately, this demonstrates that it's a business that is reinvesting profits at increasing rates of return. Having said that, from a first glance at Chart Industries (NYSE:GTLS) we aren't jumping out of our chairs at how returns are trending, but let's have a deeper look.
What Is Return On Capital Employed (ROCE)?
For those that aren't sure what ROCE is, it measures the amount of pre-tax profits a company can generate from the capital employed in its business. Analysts use this formula to calculate it for Chart Industries:
Return on Capital Employed = Earnings Before Interest and Tax (EBIT) ÷ (Total Assets - Current Liabilities)
0.036 = US$271m ÷ (US$9.4b - US$1.8b) (Based on the trailing twelve months to June 2023).
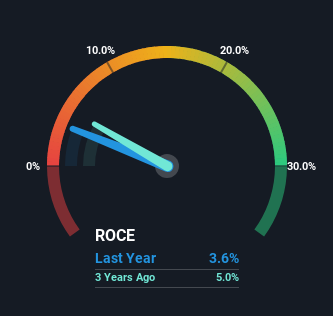
Therefore, Chart Industries has an ROCE of 3.6%. In absolute terms, that's a low return and it also under-performs the Machinery industry average of 12%.
View our latest analysis for Chart Industries
In the above chart we have measured Chart Industries' prior ROCE against its prior performance, but the future is arguably more important. If you'd like, you can check out the forecasts from the analysts covering Chart Industries here for free.
What Does the ROCE Trend For Chart Industries Tell Us?
On the surface, the trend of ROCE at Chart Industries doesn't inspire confidence. Over the last five years, returns on capital have decreased to 3.6% from 5.9% five years ago. However, given capital employed and revenue have both increased it appears that the business is currently pursuing growth, at the consequence of short term returns. And if the increased capital generates additional returns, the business, and thus shareholders, will benefit in the long run.
The Bottom Line On Chart Industries' ROCE
In summary, despite lower returns in the short term, we're encouraged to see that Chart Industries is reinvesting for growth and has higher sales as a result. And the stock has done incredibly well with a 128% return over the last five years, so long term investors are no doubt ecstatic with that result. So while the underlying trends could already be accounted for by investors, we still think this stock is worth looking into further.
Chart Industries does come with some risks though, we found 4 warning signs in our investment analysis, and 1 of those is concerning...
For those who like to invest in solid companies, check out this free list of companies with solid balance sheets and high returns on equity.
New: AI Stock Screener & Alerts
Our new AI Stock Screener scans the market every day to uncover opportunities.
• Dividend Powerhouses (3%+ Yield)
• Undervalued Small Caps with Insider Buying
• High growth Tech and AI Companies
Or build your own from over 50 metrics.
Have feedback on this article? Concerned about the content? Get in touch with us directly. Alternatively, email editorial-team (at) simplywallst.com.
This article by Simply Wall St is general in nature. We provide commentary based on historical data and analyst forecasts only using an unbiased methodology and our articles are not intended to be financial advice. It does not constitute a recommendation to buy or sell any stock, and does not take account of your objectives, or your financial situation. We aim to bring you long-term focused analysis driven by fundamental data. Note that our analysis may not factor in the latest price-sensitive company announcements or qualitative material. Simply Wall St has no position in any stocks mentioned.
About NYSE:GTLS
Chart Industries
Engages in the designing, engineering, and manufacturing of process technologies and equipment for the gas and liquid molecules in the United States and internationally.
Reasonable growth potential with acceptable track record.

