- United States
- /
- Machinery
- /
- NYSE:GTLS
Chart Industries (NYSE:GTLS) Could Be Struggling To Allocate Capital


If we want to find a potential multi-bagger, often there are underlying trends that can provide clues. Firstly, we'll want to see a proven return on capital employed (ROCE) that is increasing, and secondly, an expanding base of capital employed. This shows us that it's a compounding machine, able to continually reinvest its earnings back into the business and generate higher returns. In light of that, when we looked at Chart Industries (NYSE:GTLS) and its ROCE trend, we weren't exactly thrilled.
Understanding Return On Capital Employed (ROCE)
If you haven't worked with ROCE before, it measures the 'return' (pre-tax profit) a company generates from capital employed in its business. To calculate this metric for Chart Industries, this is the formula:
Return on Capital Employed = Earnings Before Interest and Tax (EBIT) ÷ (Total Assets - Current Liabilities)
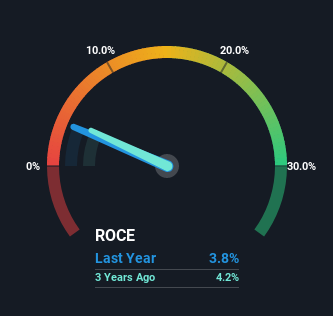
0.038 = US$285m ÷ (US$9.2b - US$1.7b) (Based on the trailing twelve months to March 2023).
So, Chart Industries has an ROCE of 3.8%. In absolute terms, that's a low return and it also under-performs the Machinery industry average of 11%.
Check out our latest analysis for Chart Industries
In the above chart we have measured Chart Industries' prior ROCE against its prior performance, but the future is arguably more important. If you'd like, you can check out the forecasts from the analysts covering Chart Industries here for free.
SWOT Analysis for Chart Industries
- Debt is well covered by earnings.
- Earnings growth over the past year underperformed the Machinery industry.
- Shareholders have been diluted in the past year.
- Annual earnings are forecast to grow faster than the American market.
- Trading below our estimate of fair value by more than 20%.
- Significant insider buying over the past 3 months.
- Debt is not well covered by operating cash flow.
- Revenue is forecast to grow slower than 20% per year.
What Can We Tell From Chart Industries' ROCE Trend?
In terms of Chart Industries' historical ROCE movements, the trend isn't fantastic. Over the last five years, returns on capital have decreased to 3.8% from 5.3% five years ago. However, given capital employed and revenue have both increased it appears that the business is currently pursuing growth, at the consequence of short term returns. If these investments prove successful, this can bode very well for long term stock performance.
The Key Takeaway
While returns have fallen for Chart Industries in recent times, we're encouraged to see that sales are growing and that the business is reinvesting in its operations. Furthermore the stock has climbed 65% over the last five years, it would appear that investors are upbeat about the future. So while investors seem to be recognizing these promising trends, we would look further into this stock to make sure the other metrics justify the positive view.
If you want to know some of the risks facing Chart Industries we've found 3 warning signs (1 doesn't sit too well with us!) that you should be aware of before investing here.
While Chart Industries isn't earning the highest return, check out this free list of companies that are earning high returns on equity with solid balance sheets.
New: AI Stock Screener & Alerts
Our new AI Stock Screener scans the market every day to uncover opportunities.
• Dividend Powerhouses (3%+ Yield)
• Undervalued Small Caps with Insider Buying
• High growth Tech and AI Companies
Or build your own from over 50 metrics.
Have feedback on this article? Concerned about the content? Get in touch with us directly. Alternatively, email editorial-team (at) simplywallst.com.
This article by Simply Wall St is general in nature. We provide commentary based on historical data and analyst forecasts only using an unbiased methodology and our articles are not intended to be financial advice. It does not constitute a recommendation to buy or sell any stock, and does not take account of your objectives, or your financial situation. We aim to bring you long-term focused analysis driven by fundamental data. Note that our analysis may not factor in the latest price-sensitive company announcements or qualitative material. Simply Wall St has no position in any stocks mentioned.
About NYSE:GTLS
Chart Industries
Engages in the designing, engineering, and manufacturing of process technologies and equipment for the gas and liquid molecules in the United States and internationally.
Reasonable growth potential with acceptable track record.

