Stock Analysis
- United States
- /
- Construction
- /
- NYSE:EME
EMCOR Group, Inc.'s (NYSE:EME) Stock Has Been Sliding But Fundamentals Look Strong: Is The Market Wrong?


With its stock down 34% over the past three months, it is easy to disregard EMCOR Group (NYSE:EME). However, stock prices are usually driven by a company’s financial performance over the long term, which in this case looks quite promising. In this article, we decided to focus on EMCOR Group's ROE.
Return on equity or ROE is a key measure used to assess how efficiently a company's management is utilizing the company's capital. In other words, it is a profitability ratio which measures the rate of return on the capital provided by the company's shareholders.
View our latest analysis for EMCOR Group
How Is ROE Calculated?
The formula for ROE is:
Return on Equity = Net Profit (from continuing operations) ÷ Shareholders' Equity
So, based on the above formula, the ROE for EMCOR Group is:
16% = US$325m ÷ US$2.1b (Based on the trailing twelve months to December 2019).
The 'return' is the profit over the last twelve months. So, this means that for every $1 of its shareholder's investments, the company generates a profit of $0.16.
What Has ROE Got To Do With Earnings Growth?
We have already established that ROE serves as an efficient profit-generating gauge for a company's future earnings. We now need to evaluate how much profit the company reinvests or "retains" for future growth which then gives us an idea about the growth potential of the company. Assuming all else is equal, companies that have both a higher return on equity and higher profit retention are usually the ones that have a higher growth rate when compared to companies that don't have the same features.
EMCOR Group's Earnings Growth And 16% ROE
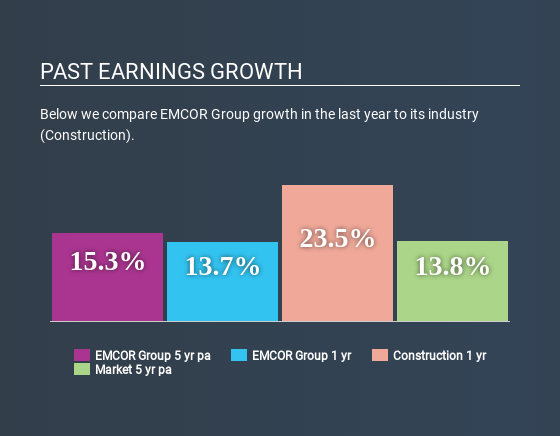
To begin with, EMCOR Group seems to have a respectable ROE. Especially when compared to the industry average of 11% the company's ROE looks pretty impressive. This probably laid the ground for EMCOR Group's moderate 15% net income growth seen over the past five years.
We then performed a comparison between EMCOR Group's net income growth with the industry, which revealed that the company's growth is similar to the average industry growth of 17% in the same period.
The basis for attaching value to a company is, to a great extent, tied to its earnings growth. The investor should try to establish if the expected growth or decline in earnings, whichever the case may be, is priced in. By doing so, they will have an idea if the stock is headed into clear blue waters or if swampy waters await. Is EMCOR Group fairly valued compared to other companies? These 3 valuation measures might help you decide.
Is EMCOR Group Efficiently Re-investing Its Profits?
EMCOR Group's three-year median payout ratio to shareholders is 10% (implying that it retains 90% of its income), which is on the lower side, so it seems like the management is reinvesting profits heavily to grow its business.
Moreover, EMCOR Group is determined to keep sharing its profits with shareholders which we infer from its long history of nine years of paying a dividend. Existing analyst estimates suggest that the company's future payout ratio is expected to drop to 4.7% over the next three years. Regardless, the ROE is not expected to change much for the company despite the lower expected payout ratio.
Summary
On the whole, we feel that EMCOR Group's performance has been quite good. Particularly, we like that the company is reinvesting heavily into its business, and at a high rate of return. Unsurprisingly, this has led to an impressive earnings growth. Having said that, the company's earnings growth is expected to slow down, as forecasted in the current analyst estimates. To know more about the company's future earnings growth forecasts take a look at this free report on analyst forecasts for the company to find out more.
If you spot an error that warrants correction, please contact the editor at editorial-team@simplywallst.com. This article by Simply Wall St is general in nature. It does not constitute a recommendation to buy or sell any stock, and does not take account of your objectives, or your financial situation. Simply Wall St has no position in the stocks mentioned.
We aim to bring you long-term focused research analysis driven by fundamental data. Note that our analysis may not factor in the latest price-sensitive company announcements or qualitative material. Thank you for reading.
About NYSE:EME
EMCOR Group
Provides construction and facilities, building, and industrial services in the United States and the United Kingdom.
Outstanding track record with flawless balance sheet.
