- United States
- /
- Electrical
- /
- NYSE:AYI
Acuity Brands, Inc.'s (NYSE:AYI) Stock Has Been Sliding But Fundamentals Look Strong: Is The Market Wrong?


It is hard to get excited after looking at Acuity Brands' (NYSE:AYI) recent performance, when its stock has declined 8.2% over the past month. However, stock prices are usually driven by a company’s financial performance over the long term, which in this case looks quite promising. Particularly, we will be paying attention to Acuity Brands' ROE today.
Return on Equity or ROE is a test of how effectively a company is growing its value and managing investors’ money. In simpler terms, it measures the profitability of a company in relation to shareholder's equity.
Check out our latest analysis for Acuity Brands
How To Calculate Return On Equity?
ROE can be calculated by using the formula:
Return on Equity = Net Profit (from continuing operations) ÷ Shareholders' Equity
So, based on the above formula, the ROE for Acuity Brands is:
18% = US$378m ÷ US$2.1b (Based on the trailing twelve months to February 2024).
The 'return' is the yearly profit. Another way to think of that is that for every $1 worth of equity, the company was able to earn $0.18 in profit.
Why Is ROE Important For Earnings Growth?
So far, we've learned that ROE is a measure of a company's profitability. Based on how much of its profits the company chooses to reinvest or "retain", we are then able to evaluate a company's future ability to generate profits. Assuming everything else remains unchanged, the higher the ROE and profit retention, the higher the growth rate of a company compared to companies that don't necessarily bear these characteristics.
A Side By Side comparison of Acuity Brands' Earnings Growth And 18% ROE
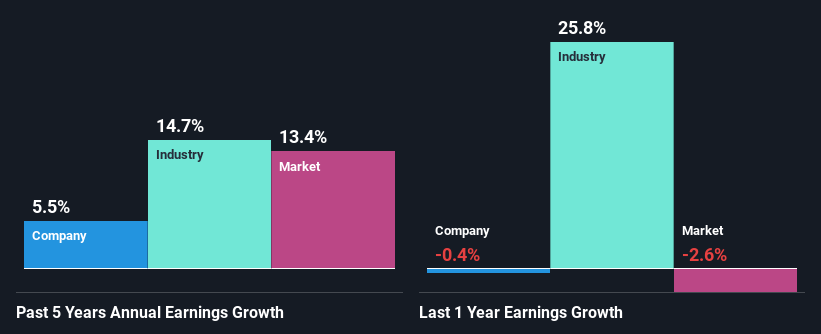
To start with, Acuity Brands' ROE looks acceptable. Even when compared to the industry average of 15% the company's ROE looks quite decent. Consequently, this likely laid the ground for the decent growth of 5.5% seen over the past five years by Acuity Brands.
As a next step, we compared Acuity Brands' net income growth with the industry and were disappointed to see that the company's growth is lower than the industry average growth of 15% in the same period.
Earnings growth is an important metric to consider when valuing a stock. What investors need to determine next is if the expected earnings growth, or the lack of it, is already built into the share price. This then helps them determine if the stock is placed for a bright or bleak future. Has the market priced in the future outlook for AYI? You can find out in our latest intrinsic value infographic research report.
Is Acuity Brands Making Efficient Use Of Its Profits?
In Acuity Brands' case, its respectable earnings growth can probably be explained by its low three-year median payout ratio of 4.8% (or a retention ratio of 95%), which suggests that the company is investing most of its profits to grow its business.
Additionally, Acuity Brands has paid dividends over a period of at least ten years which means that the company is pretty serious about sharing its profits with shareholders. Existing analyst estimates suggest that the company's future payout ratio is expected to drop to 3.5% over the next three years. Despite the lower expected payout ratio, the company's ROE is not expected to change by much.
Conclusion
In total, we are pretty happy with Acuity Brands' performance. Specifically, we like that the company is reinvesting a huge chunk of its profits at a high rate of return. This of course has caused the company to see a good amount of growth in its earnings. On studying current analyst estimates, we found that analysts expect the company to continue its recent growth streak. Are these analysts expectations based on the broad expectations for the industry, or on the company's fundamentals? Click here to be taken to our analyst's forecasts page for the company.
New: Manage All Your Stock Portfolios in One Place
We've created the ultimate portfolio companion for stock investors, and it's free.
• Connect an unlimited number of Portfolios and see your total in one currency
• Be alerted to new Warning Signs or Risks via email or mobile
• Track the Fair Value of your stocks
Have feedback on this article? Concerned about the content? Get in touch with us directly. Alternatively, email editorial-team (at) simplywallst.com.
This article by Simply Wall St is general in nature. We provide commentary based on historical data and analyst forecasts only using an unbiased methodology and our articles are not intended to be financial advice. It does not constitute a recommendation to buy or sell any stock, and does not take account of your objectives, or your financial situation. We aim to bring you long-term focused analysis driven by fundamental data. Note that our analysis may not factor in the latest price-sensitive company announcements or qualitative material. Simply Wall St has no position in any stocks mentioned.
About NYSE:AYI
Acuity Brands
Provides lighting, lighting controls, building management system, location-aware applications in the United States and internationally.
Solid track record with excellent balance sheet.
