- United States
- /
- Machinery
- /
- NYSE:AGCO
AGCO (NYSE:AGCO) stock performs better than its underlying earnings growth over last five years


When you buy and hold a stock for the long term, you definitely want it to provide a positive return. Furthermore, you'd generally like to see the share price rise faster than the market. Unfortunately for shareholders, while the AGCO Corporation (NYSE:AGCO) share price is up 73% in the last five years, that's less than the market return. However, if you include the dividends then the return is market beating. The last year has been disappointing, with the stock price down 2.2% in that time.
Since the stock has added US$278m to its market cap in the past week alone, let's see if underlying performance has been driving long-term returns.
See our latest analysis for AGCO
In his essay The Superinvestors of Graham-and-Doddsville Warren Buffett described how share prices do not always rationally reflect the value of a business. One imperfect but simple way to consider how the market perception of a company has shifted is to compare the change in the earnings per share (EPS) with the share price movement.
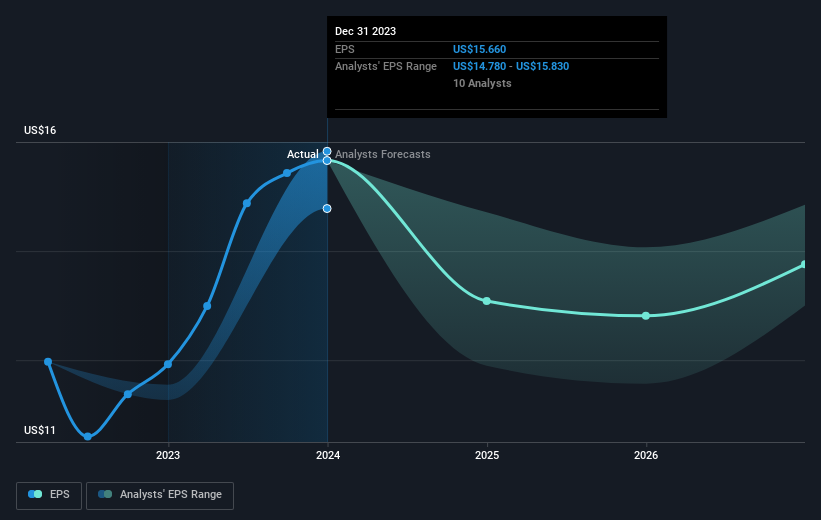
During five years of share price growth, AGCO achieved compound earnings per share (EPS) growth of 34% per year. The EPS growth is more impressive than the yearly share price gain of 12% over the same period. So one could conclude that the broader market has become more cautious towards the stock. This cautious sentiment is reflected in its (fairly low) P/E ratio of 7.42.
You can see how EPS has changed over time in the image below (click on the chart to see the exact values).
It is of course excellent to see how AGCO has grown profits over the years, but the future is more important for shareholders. If you are thinking of buying or selling AGCO stock, you should check out this FREE detailed report on its balance sheet.
What About Dividends?
It is important to consider the total shareholder return, as well as the share price return, for any given stock. The TSR is a return calculation that accounts for the value of cash dividends (assuming that any dividend received was reinvested) and the calculated value of any discounted capital raisings and spin-offs. Arguably, the TSR gives a more comprehensive picture of the return generated by a stock. As it happens, AGCO's TSR for the last 5 years was 100%, which exceeds the share price return mentioned earlier. This is largely a result of its dividend payments!
A Different Perspective
AGCO provided a TSR of 3.0% over the last twelve months. But that return falls short of the market. If we look back over five years, the returns are even better, coming in at 15% per year for five years. It's quite possible the business continues to execute with prowess, even as the share price gains are slowing. I find it very interesting to look at share price over the long term as a proxy for business performance. But to truly gain insight, we need to consider other information, too. Even so, be aware that AGCO is showing 1 warning sign in our investment analysis , you should know about...
For those who like to find winning investments this free list of growing companies with recent insider purchasing, could be just the ticket.
Please note, the market returns quoted in this article reflect the market weighted average returns of stocks that currently trade on American exchanges.
New: Manage All Your Stock Portfolios in One Place
We've created the ultimate portfolio companion for stock investors, and it's free.
• Connect an unlimited number of Portfolios and see your total in one currency
• Be alerted to new Warning Signs or Risks via email or mobile
• Track the Fair Value of your stocks
Have feedback on this article? Concerned about the content? Get in touch with us directly. Alternatively, email editorial-team (at) simplywallst.com.
This article by Simply Wall St is general in nature. We provide commentary based on historical data and analyst forecasts only using an unbiased methodology and our articles are not intended to be financial advice. It does not constitute a recommendation to buy or sell any stock, and does not take account of your objectives, or your financial situation. We aim to bring you long-term focused analysis driven by fundamental data. Note that our analysis may not factor in the latest price-sensitive company announcements or qualitative material. Simply Wall St has no position in any stocks mentioned.
About NYSE:AGCO
AGCO
Manufactures and distributes agricultural equipment and related replacement parts worldwide.
Adequate balance sheet average dividend payer.
