Advertisement
- United States
- /
- Machinery
- /
- NasdaqGM:SYM
What the Recent 22% Pullback Means for Symbotic’s True Value in 2025

Simply Wall St
Reviewed by Bailey Pemberton
- Wondering if Symbotic’s recent run-up is all hype or actually backed by value? Let’s break down what’s really going on with this high-flying stock.
- After a jaw-dropping 121.4% year-to-date climb and a 347.8% gain over three years, Symbotic recently took a breather, dropping 21.7% over the past month.
- Investor excitement has been fueled by high-profile new automation contracts and growing headlines around warehouse robotics. However, short-term volatility has also increased as the broader tech sector wobbled. News of Symbotic partnering with major retailers has grabbed attention and helped explain some of the sharp recent price swings.
- On our 6-point valuation check, Symbotic scores 4 out of 6 for being undervalued. This is solid, but perhaps not the whole story. We will explore what this means using a few different valuation lenses, and at the end of the article, reveal a smarter approach that could be the key to really understanding what Symbotic is worth.
Approach 1: Symbotic Discounted Cash Flow (DCF) Analysis
A Discounted Cash Flow (DCF) model estimates what a company is worth today by forecasting its future cash flows and discounting them back to their present value. For Symbotic, this involves predicting how much money the business will generate and accounting for the risk and value of waiting for those future cash flows.
Currently, Symbotic is generating $188.3 million in Free Cash Flow (FCF). Analyst consensus covers the next five years, after which Simply Wall St extrapolates further. By 2030, FCF is projected to reach $1.7 billion, reflecting substantial expected growth as the company scales up its operations. Each of these future cash flows is discounted to reflect today's value, given the time and risk.
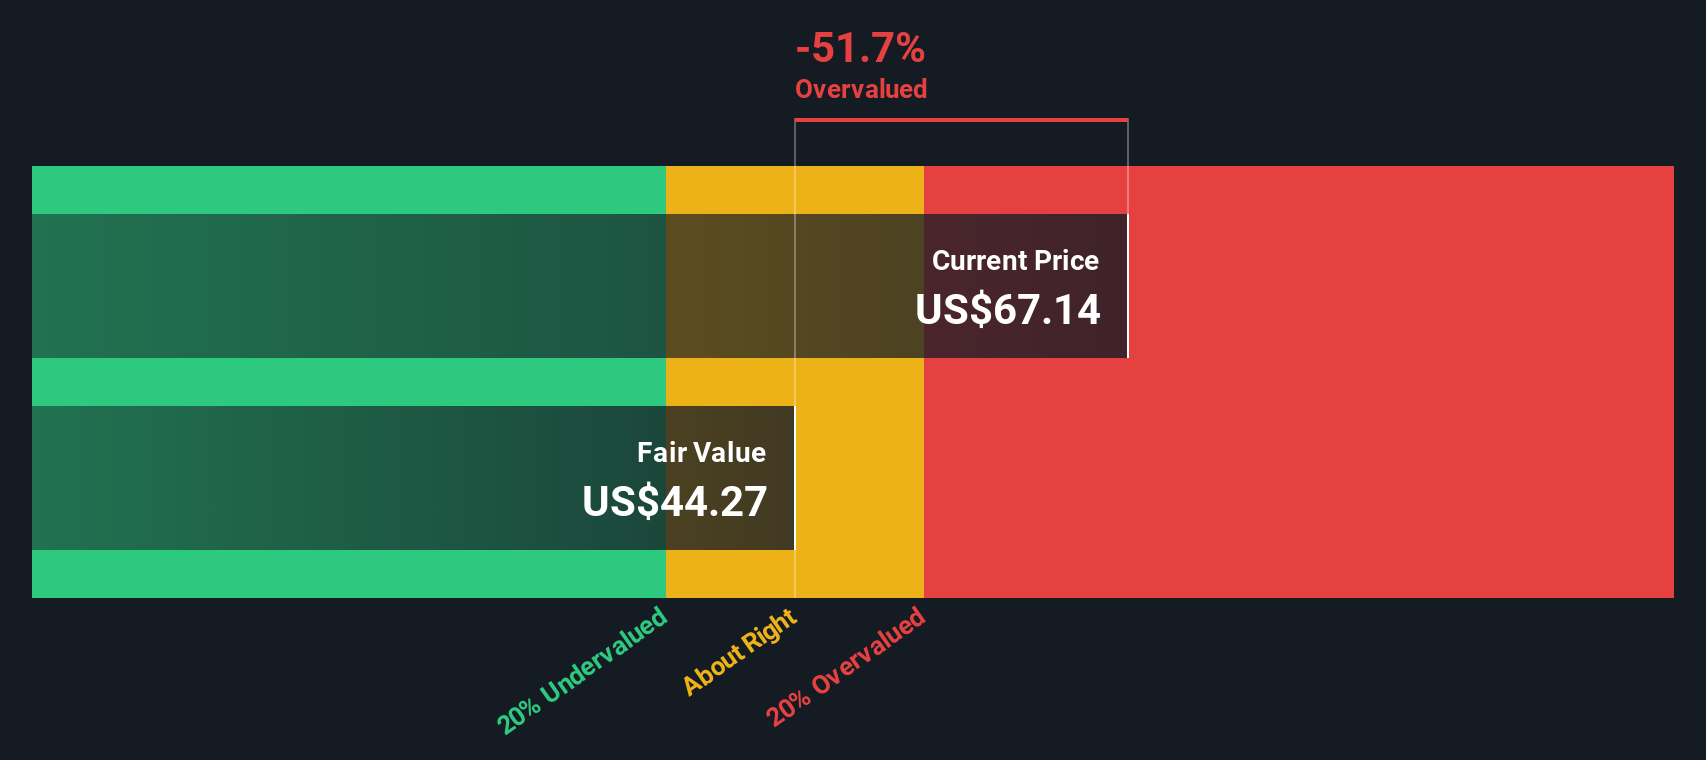
Based on the analysis, Symbotic’s estimated intrinsic value comes out to $70.57 per share according to the two-stage Free Cash Flow to Equity method. This figure is about 22.5% higher than its current market price, implying that the stock is undervalued on this metric.
Result: UNDERVALUED
Our Discounted Cash Flow (DCF) analysis suggests Symbotic is undervalued by 22.5%. Track this in your watchlist or portfolio, or discover 923 more undervalued stocks based on cash flows.
Approach 2: Symbotic Price vs Sales
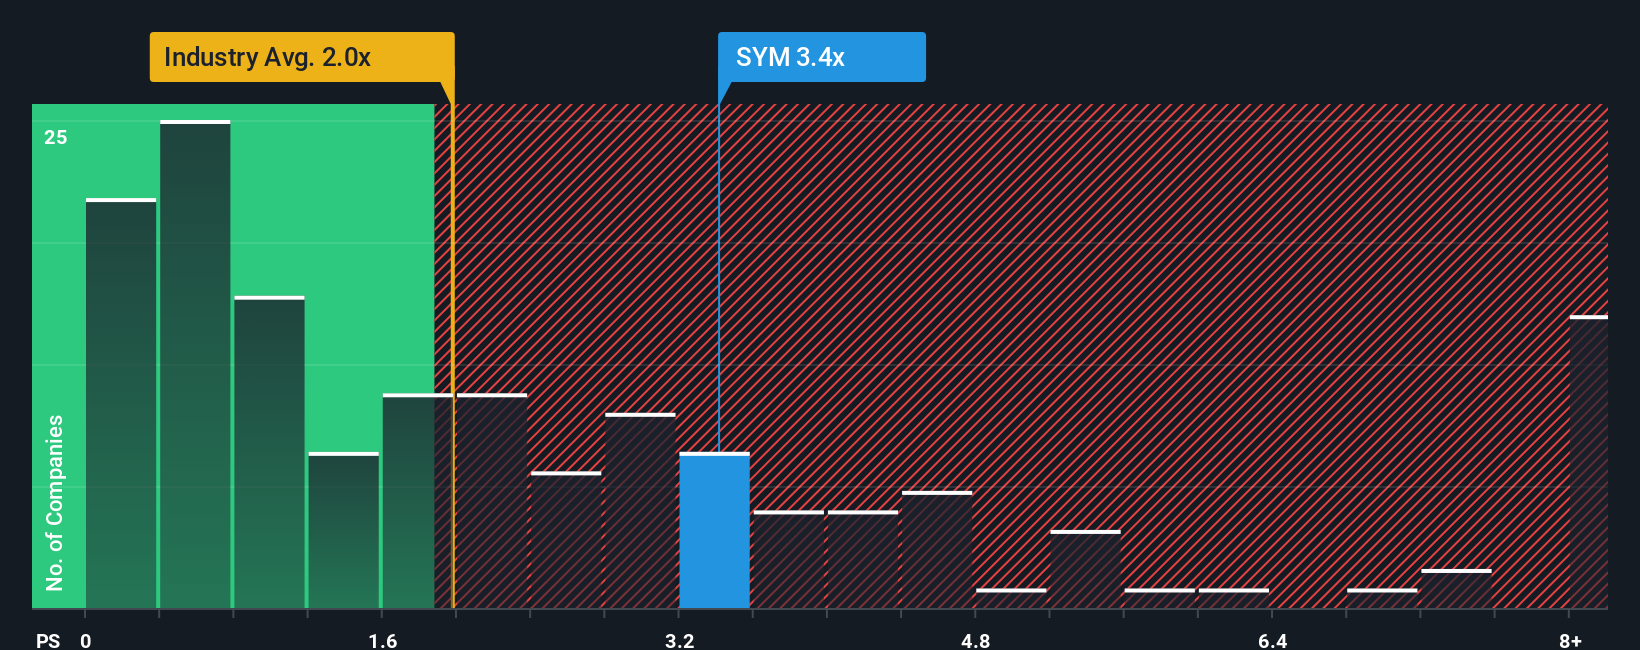
For rapidly growing companies like Symbotic, which are not yet consistently profitable, the Price-to-Sales (PS) ratio is a widely used valuation tool. This metric helps investors gauge how much they are paying for each dollar of the company’s revenue. Because sales figures are less likely to be distorted by accounting choices and short-term profitability swings, the PS ratio is particularly useful for early-stage innovators and high-growth firms.
Investors often look to the industry average and peer group for context. Symbotic’s current PS ratio is 2.8x, which compares to an industry average of 1.88x and a peer average of 3.29x. On a surface level, this puts Symbotic’s valuation a bit below its closest rivals but still above the average for machinery stocks in general. However, knowing if a company is “fairly” valued requires factoring in differences in growth, risks, profit margins, and market size.
This is where Simply Wall St’s "Fair Ratio" comes in. The Fair Ratio is a proprietary multiple that incorporates not just industry positioning but also Symbotic’s unique prospects and risks. Unlike the blunt comparison to peers or industry averages, the Fair Ratio (3.93x for Symbotic) is tailored to what investors should reasonably expect, given the company’s strong growth outlook and competitive edge. Since Symbotic’s current PS ratio is meaningfully below its Fair Ratio, it suggests the stock is undervalued on this metric.
Result: UNDERVALUED
PS ratios tell one story, but what if the real opportunity lies elsewhere? Discover 1424 companies where insiders are betting big on explosive growth.
Upgrade Your Decision Making: Choose your Symbotic Narrative
Earlier, we mentioned that there is an even better way to understand valuation, so let's introduce you to Narratives.
Narratives are a simple but powerful tool that lets you create your own story about Symbotic. You can connect your unique insights, expectations for revenue and earnings, and assumptions about growth or margins into a clear financial forecast and a fair value estimate.
Instead of just looking at numbers in isolation, Narratives put the company’s story at the heart of your investment case. This approach allows you to test “what if” scenarios, easily visualize the implications, and see how your view stacks up against others.
Available on the Simply Wall St Community page and used by millions of investors, Narratives let you update your outlook whenever there is fresh news or an earnings surprise. As the real story evolves, your forecast and fair value can move accordingly.
If you think Symbotic will overcome deployment risks and deliver high sustained growth, your Narrative might set a fair value above $60. If you're cautious about concentration risk or near-term growth, you might calculate a fair value closer to $10. Both perspectives exist in the community, and Narratives make it easy to explore and compare them for smarter buy or sell decisions.
Do you think there's more to the story for Symbotic? Head over to our Community to see what others are saying!
This article by Simply Wall St is general in nature. We provide commentary based on historical data and analyst forecasts only using an unbiased methodology and our articles are not intended to be financial advice. It does not constitute a recommendation to buy or sell any stock, and does not take account of your objectives, or your financial situation. We aim to bring you long-term focused analysis driven by fundamental data. Note that our analysis may not factor in the latest price-sensitive company announcements or qualitative material. Simply Wall St has no position in any stocks mentioned.
New: Manage All Your Stock Portfolios in One Place
We've created the ultimate portfolio companion for stock investors, and it's free.
• Connect an unlimited number of Portfolios and see your total in one currency
• Be alerted to new Warning Signs or Risks via email or mobile
• Track the Fair Value of your stocks
Have feedback on this article? Concerned about the content? Get in touch with us directly. Alternatively, email editorial-team@simplywallst.com
About NasdaqGM:SYM
Symbotic
An automation technology company, develops technologies to enhance operating efficiencies in modern warehouses.
Flawless balance sheet with high growth potential.
Similar Companies
Market Insights

Advertisement
Community Narratives
MicroVision will explode future revenue by 380.37% with a vision towards success
Fair Value US$60.00|98.5% undervalued
TH
Community Contributor
The Indispensable Artery for a New North American Economy
Fair Value CA$132.87|2.3% undervalued
TI
Community Contributor