- United States
- /
- Machinery
- /
- NasdaqGM:SYM
Positive Sentiment Still Eludes Symbotic Inc. (NASDAQ:SYM) Following 28% Share Price Slump
Symbotic Inc. (NASDAQ:SYM) shareholders won't be pleased to see that the share price has had a very rough month, dropping 28% and undoing the prior period's positive performance. Instead of being rewarded, shareholders who have already held through the last twelve months are now sitting on a 48% share price drop.
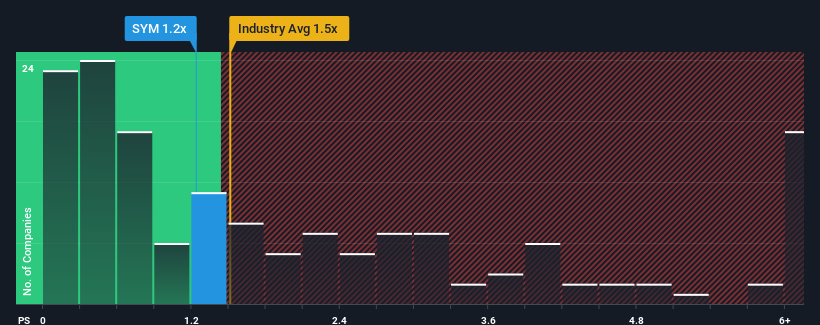
Even after such a large drop in price, there still wouldn't be many who think Symbotic's price-to-sales (or "P/S") ratio of 1.2x is worth a mention when the median P/S in the United States' Machinery industry is similar at about 1.5x. Although, it's not wise to simply ignore the P/S without explanation as investors may be disregarding a distinct opportunity or a costly mistake.
See our latest analysis for Symbotic

How Symbotic Has Been Performing
Recent times have been pleasing for Symbotic as its revenue has risen in spite of the industry's average revenue going into reverse. Perhaps the market is expecting its current strong performance to taper off in accordance to the rest of the industry, which has kept the P/S contained. If not, then existing shareholders have reason to be feeling optimistic about the future direction of the share price.
Keen to find out how analysts think Symbotic's future stacks up against the industry? In that case, our free report is a great place to start.How Is Symbotic's Revenue Growth Trending?
Symbotic's P/S ratio would be typical for a company that's only expected to deliver moderate growth, and importantly, perform in line with the industry.
Taking a look back first, we see that the company grew revenue by an impressive 44% last year. This great performance means it was also able to deliver immense revenue growth over the last three years. So we can start by confirming that the company has done a tremendous job of growing revenue over that time.
Shifting to the future, estimates from the analysts covering the company suggest revenue growth will be highly resilient over the next year growing by 28%. Meanwhile, the broader industry is forecast to contract by 0.6%, which would indicate the company is doing very well.
With this in mind, we find it intriguing that Symbotic's P/S trades in-line with its industry peers. It looks like most investors aren't convinced the company can achieve positive future growth in the face of a shrinking broader industry.
The Bottom Line On Symbotic's P/S
Following Symbotic's share price tumble, its P/S is just clinging on to the industry median P/S. Using the price-to-sales ratio alone to determine if you should sell your stock isn't sensible, however it can be a practical guide to the company's future prospects.
Our examination of Symbotic's analyst forecasts revealed that its superior revenue outlook against a shaky industry isn't resulting in the company trading at a higher P/S, as per our expectations. Given the glowing revenue forecasts, we can only assume potential risks are what might be capping the P/S ratio at its current levels. One such risk is that the company may not live up to analysts' revenue trajectories in tough industry conditions. However, if you agree with the analysts' forecasts, you may be able to pick up the stock at an attractive price.
It is also worth noting that we have found 2 warning signs for Symbotic that you need to take into consideration.
Of course, profitable companies with a history of great earnings growth are generally safer bets. So you may wish to see this free collection of other companies that have reasonable P/E ratios and have grown earnings strongly.
New: Manage All Your Stock Portfolios in One Place
We've created the ultimate portfolio companion for stock investors, and it's free.
• Connect an unlimited number of Portfolios and see your total in one currency
• Be alerted to new Warning Signs or Risks via email or mobile
• Track the Fair Value of your stocks
Have feedback on this article? Concerned about the content? Get in touch with us directly. Alternatively, email editorial-team (at) simplywallst.com.
This article by Simply Wall St is general in nature. We provide commentary based on historical data and analyst forecasts only using an unbiased methodology and our articles are not intended to be financial advice. It does not constitute a recommendation to buy or sell any stock, and does not take account of your objectives, or your financial situation. We aim to bring you long-term focused analysis driven by fundamental data. Note that our analysis may not factor in the latest price-sensitive company announcements or qualitative material. Simply Wall St has no position in any stocks mentioned.
About NasdaqGM:SYM
Symbotic
An automation technology company, develops technologies to enhance operating efficiencies in modern warehouses.
Flawless balance sheet with high growth potential.
Similar Companies
Market Insights
Community Narratives


Recently Updated Narratives

Astor Enerji will surge with a fair value of $140.43 in the next 3 years

Proximus: The State-Backed Backup Plan with 7% Gross Yield and 15% Currency Upside.


A case for for IMPACT Silver Corp (TSXV:IPT) to reach USD $4.52 (CAD $6.16) in 2026 (23 bagger in 1 year) and USD $5.76 (CAD $7.89) by 2030
Popular Narratives


MicroVision will explode future revenue by 380.37% with a vision towards success


The company that turned a verb into a global necessity and basically runs the modern internet, digital ads, smartphones, maps, and AI.


