
Advertisement
Warren Buffett famously said, 'Volatility is far from synonymous with risk.' So it might be obvious that you need to consider debt, when you think about how risky any given stock is, because too much debt can sink a company. We note that Sunrun Inc. (NASDAQ:RUN) does have debt on its balance sheet. But the real question is whether this debt is making the company risky.
Why Does Debt Bring Risk?
Debt and other liabilities become risky for a business when it cannot easily fulfill those obligations, either with free cash flow or by raising capital at an attractive price. Part and parcel of capitalism is the process of 'creative destruction' where failed businesses are mercilessly liquidated by their bankers. However, a more common (but still painful) scenario is that it has to raise new equity capital at a low price, thus permanently diluting shareholders. Of course, plenty of companies use debt to fund growth, without any negative consequences. The first thing to do when considering how much debt a business uses is to look at its cash and debt together.
See our latest analysis for Sunrun
How Much Debt Does Sunrun Carry?
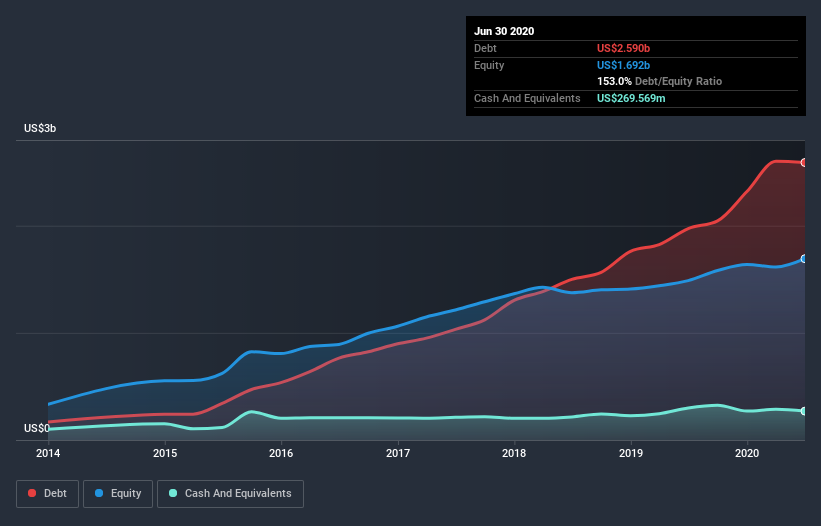
The image below, which you can click on for greater detail, shows that at June 2020 Sunrun had debt of US$2.59b, up from US$1.97b in one year. However, it also had US$269.6m in cash, and so its net debt is US$2.32b.
How Strong Is Sunrun's Balance Sheet?
The latest balance sheet data shows that Sunrun had liabilities of US$517.3m due within a year, and liabilities of US$3.80b falling due after that. Offsetting this, it had US$269.6m in cash and US$60.0m in receivables that were due within 12 months. So it has liabilities totalling US$3.98b more than its cash and near-term receivables, combined.
This deficit isn't so bad because Sunrun is worth US$9.06b, and thus could probably raise enough capital to shore up its balance sheet, if the need arose. But it's clear that we should definitely closely examine whether it can manage its debt without dilution. The balance sheet is clearly the area to focus on when you are analysing debt. But ultimately the future profitability of the business will decide if Sunrun can strengthen its balance sheet over time. So if you're focused on the future you can check out this free report showing analyst profit forecasts.
In the last year Sunrun's revenue was pretty flat, and it made a negative EBIT. While that's not too bad, we'd prefer see growth.
Caveat Emptor
Over the last twelve months Sunrun produced an earnings before interest and tax (EBIT) loss. Indeed, it lost US$249m at the EBIT level. When we look at that and recall the liabilities on its balance sheet, relative to cash, it seems unwise to us for the company to have any debt. Quite frankly we think the balance sheet is far from match-fit, although it could be improved with time. Another cause for caution is that is bled US$1.1b in negative free cash flow over the last twelve months. So in short it's a really risky stock. The balance sheet is clearly the area to focus on when you are analysing debt. However, not all investment risk resides within the balance sheet - far from it. Be aware that Sunrun is showing 4 warning signs in our investment analysis , and 1 of those is a bit concerning...
At the end of the day, it's often better to focus on companies that are free from net debt. You can access our special list of such companies (all with a track record of profit growth). It's free.
When trading Sunrun or any other investment, use the platform considered by many to be the Professional's Gateway to the Worlds Market, Interactive Brokers. You get the lowest-cost* trading on stocks, options, futures, forex, bonds and funds worldwide from a single integrated account. Promoted
New: Manage All Your Stock Portfolios in One Place
We've created the ultimate portfolio companion for stock investors, and it's free.
• Connect an unlimited number of Portfolios and see your total in one currency
• Be alerted to new Warning Signs or Risks via email or mobile
• Track the Fair Value of your stocks
This article by Simply Wall St is general in nature. It does not constitute a recommendation to buy or sell any stock, and does not take account of your objectives, or your financial situation. We aim to bring you long-term focused analysis driven by fundamental data. Note that our analysis may not factor in the latest price-sensitive company announcements or qualitative material. Simply Wall St has no position in any stocks mentioned.
*Interactive Brokers Rated Lowest Cost Broker by StockBrokers.com Annual Online Review 2020
Have feedback on this article? Concerned about the content? Get in touch with us directly. Alternatively, email editorial-team@simplywallst.com.
About NasdaqGS:RUN
Sunrun
Designs, develops, installs, sells, owns, and maintains residential solar energy systems in the United States.
Good value with moderate growth potential.
Similar Companies
Market Insights

Advertisement
Community Narratives
MicroVision will explode future revenue by 380.37% with a vision towards success
Fair Value US$60.00|98.5% undervalued
TH
Community Contributor
The Indispensable Artery for a New North American Economy
Fair Value CA$132.87|2.3% undervalued
TI
Community Contributor