
Advertisement
- United States
- /
- Electrical
- /
- NasdaqCM:RAYA
Erayak Power Solution Group (NASDAQ:RAYA) Will Want To Turn Around Its Return Trends
Did you know there are some financial metrics that can provide clues of a potential multi-bagger? Amongst other things, we'll want to see two things; firstly, a growing return on capital employed (ROCE) and secondly, an expansion in the company's amount of capital employed. If you see this, it typically means it's a company with a great business model and plenty of profitable reinvestment opportunities. In light of that, when we looked at Erayak Power Solution Group (NASDAQ:RAYA) and its ROCE trend, we weren't exactly thrilled.
What Is Return On Capital Employed (ROCE)?
Just to clarify if you're unsure, ROCE is a metric for evaluating how much pre-tax income (in percentage terms) a company earns on the capital invested in its business. The formula for this calculation on Erayak Power Solution Group is:
Return on Capital Employed = Earnings Before Interest and Tax (EBIT) ÷ (Total Assets - Current Liabilities)
0.11 = US$2.1m ÷ (US$35m - US$15m) (Based on the trailing twelve months to June 2023).
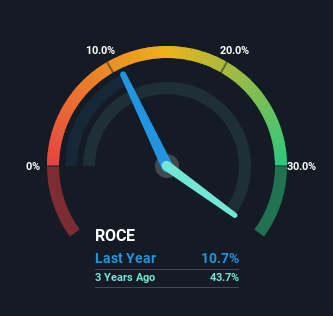
Therefore, Erayak Power Solution Group has an ROCE of 11%. In isolation, that's a pretty standard return but against the Electrical industry average of 14%, it's not as good.
Check out our latest analysis for Erayak Power Solution Group
Above you can see how the current ROCE for Erayak Power Solution Group compares to its prior returns on capital, but there's only so much you can tell from the past. If you'd like to see what analysts are forecasting going forward, you should check out our free analyst report for Erayak Power Solution Group .
How Are Returns Trending?
In terms of Erayak Power Solution Group's historical ROCE movements, the trend isn't fantastic. To be more specific, ROCE has fallen from 44% over the last three years. Although, given both revenue and the amount of assets employed in the business have increased, it could suggest the company is investing in growth, and the extra capital has led to a short-term reduction in ROCE. And if the increased capital generates additional returns, the business, and thus shareholders, will benefit in the long run.
On a related note, Erayak Power Solution Group has decreased its current liabilities to 44% of total assets. That could partly explain why the ROCE has dropped. Effectively this means their suppliers or short-term creditors are funding less of the business, which reduces some elements of risk. Some would claim this reduces the business' efficiency at generating ROCE since it is now funding more of the operations with its own money. Either way, they're still at a pretty high level, so we'd like to see them fall further if possible.
In Conclusion...
Even though returns on capital have fallen in the short term, we find it promising that revenue and capital employed have both increased for Erayak Power Solution Group. Despite these promising trends, the stock has collapsed 75% over the last year, so there could be other factors hurting the company's prospects. Regardless, reinvestment can pay off in the long run, so we think astute investors may want to look further into this stock.
One more thing: We've identified 3 warning signs with Erayak Power Solution Group (at least 2 which make us uncomfortable) , and understanding them would certainly be useful.
While Erayak Power Solution Group may not currently earn the highest returns, we've compiled a list of companies that currently earn more than 25% return on equity. Check out this free list here.
Valuation is complex, but we're here to simplify it.
Discover if Erayak Power Solution Group might be undervalued or overvalued with our detailed analysis, featuring fair value estimates, potential risks, dividends, insider trades, and its financial condition.
Access Free AnalysisHave feedback on this article? Concerned about the content? Get in touch with us directly. Alternatively, email editorial-team (at) simplywallst.com.
This article by Simply Wall St is general in nature. We provide commentary based on historical data and analyst forecasts only using an unbiased methodology and our articles are not intended to be financial advice. It does not constitute a recommendation to buy or sell any stock, and does not take account of your objectives, or your financial situation. We aim to bring you long-term focused analysis driven by fundamental data. Note that our analysis may not factor in the latest price-sensitive company announcements or qualitative material. Simply Wall St has no position in any stocks mentioned.
About NasdaqCM:RAYA
Erayak Power Solution Group
Through its subsidiaries, engages in the research and development, manufacture, and wholesale and retail of power solution products in China, Australia, Poland, the United Kingdom, Germany, and internationally.
Moderate risk with adequate balance sheet.
Market Insights

Advertisement
Community Narratives
MicroVision will explode future revenue by 380.37% with a vision towards success
Fair Value US$60|98.4% undervalued
TH
Community Contributor
The Indispensable Artery for a New North American Economy
Fair Value CA$132.87|1.6% undervalued
TI
Community Contributor
Recently Updated Narratives
BE


Bejgal on MINISO Group Holding ·
MINISO's fair value is projected at 26.69 with an anticipated PE ratio shift of 20x
Fair Value:US$26.6928.0% undervalued
44 followersusers have followed this narrative
3 commentsusers have commented on this narrative
0 likesusers have liked this narrative
TI


TickerTickle on Oracle ·
The Quiet Giant That Became AI’s Power Grid
Fair Value:US$389.8149.5% undervalued
7 followersusers have followed this narrative
1 commentusers have commented on this narrative
0 likesusers have liked this narrative
AU

AuCA on Nova Ljubljanska Banka d.d ·
Nova Ljubljanska Banka d.d will expect a 11.2% revenue boost driving future growth
Fair Value:€20916.5% undervalued
23 followersusers have followed this narrative
3 commentsusers have commented on this narrative
0 likesusers have liked this narrative
Popular Narratives
OS


oscargarcia on Alphabet ·
The company that turned a verb into a global necessity and basically runs the modern internet, digital ads, smartphones, maps, and AI.
Fair Value:US$3404.9% undervalued
136 followersusers have followed this narrative
6 commentsusers have commented on this narrative
18 likesusers have liked this narrative
TH

TheWallstreetKing on MicroVision ·
MicroVision will explode future revenue by 380.37% with a vision towards success
Fair Value:US$6098.4% undervalued
87 followersusers have followed this narrative
11 commentsusers have commented on this narrative
18 likesusers have liked this narrative
AN


AnalystConsensusTarget on NVIDIA ·
NVDA: Expanding AI Demand Will Drive Major Data Center Investments Through 2026
Fair Value:US$232.7923.6% undervalued
925 followersusers have followed this narrative
6 commentsusers have commented on this narrative
22 likesusers have liked this narrative