Stock Analysis
- United States
- /
- Building
- /
- NasdaqGS:AMWD
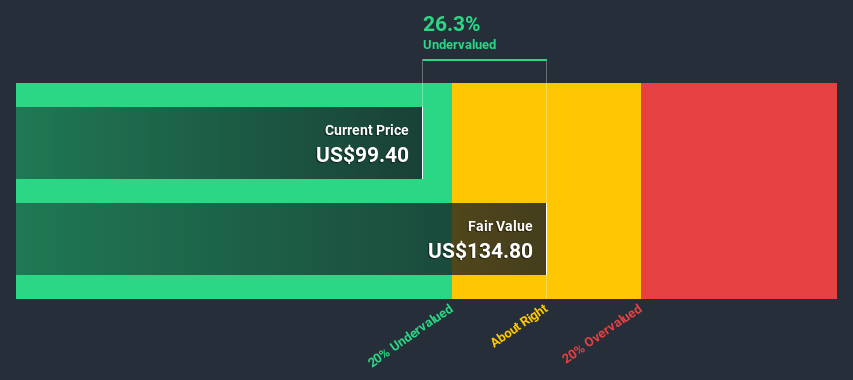
American Woodmark Corporation (NASDAQ:AMWD) Shares Could Be 26% Below Their Intrinsic Value Estimate


Today we'll do a simple run through of a valuation method used to estimate the attractiveness of American Woodmark Corporation (NASDAQ:AMWD) as an investment opportunity by taking the forecast future cash flows of the company and discounting them back to today's value. One way to achieve this is by employing the Discounted Cash Flow (DCF) model. There's really not all that much to it, even though it might appear quite complex.
We would caution that there are many ways of valuing a company and, like the DCF, each technique has advantages and disadvantages in certain scenarios. For those who are keen learners of equity analysis, the Simply Wall St analysis model here may be something of interest to you.
View our latest analysis for American Woodmark
The method
We use what is known as a 2-stage model, which simply means we have two different periods of growth rates for the company's cash flows. Generally the first stage is higher growth, and the second stage is a lower growth phase. To start off with, we need to estimate the next ten years of cash flows. Where possible we use analyst estimates, but when these aren't available we extrapolate the previous free cash flow (FCF) from the last estimate or reported value. We assume companies with shrinking free cash flow will slow their rate of shrinkage, and that companies with growing free cash flow will see their growth rate slow, over this period. We do this to reflect that growth tends to slow more in the early years than it does in later years.
A DCF is all about the idea that a dollar in the future is less valuable than a dollar today, and so the sum of these future cash flows is then discounted to today's value:
10-year free cash flow (FCF) estimate
| 2021 | 2022 | 2023 | 2024 | 2025 | 2026 | 2027 | 2028 | 2029 | 2030 | |
| Levered FCF ($, Millions) | US$126.4m | US$144.8m | US$161.8m | US$170.9m | US$178.7m | US$185.5m | US$191.6m | US$197.2m | US$202.4m | US$207.4m |
| Growth Rate Estimate Source | Analyst x4 | Analyst x4 | Analyst x2 | Est @ 5.65% | Est @ 4.57% | Est @ 3.81% | Est @ 3.28% | Est @ 2.91% | Est @ 2.65% | Est @ 2.47% |
| Present Value ($, Millions) Discounted @ 9.3% | US$116 | US$121 | US$124 | US$120 | US$115 | US$109 | US$103 | US$97.1 | US$91.3 | US$85.6 |
("Est" = FCF growth rate estimated by Simply Wall St)
Present Value of 10-year Cash Flow (PVCF) = US$1.1b
The second stage is also known as Terminal Value, this is the business's cash flow after the first stage. For a number of reasons a very conservative growth rate is used that cannot exceed that of a country's GDP growth. In this case we have used the 5-year average of the 10-year government bond yield (2.0%) to estimate future growth. In the same way as with the 10-year 'growth' period, we discount future cash flows to today's value, using a cost of equity of 9.3%.
Terminal Value (TV)= FCF2030 × (1 + g) ÷ (r – g) = US$207m× (1 + 2.0%) ÷ (9.3%– 2.0%) = US$2.9b
Present Value of Terminal Value (PVTV)= TV / (1 + r)10= US$2.9b÷ ( 1 + 9.3%)10= US$1.2b
The total value, or equity value, is then the sum of the present value of the future cash flows, which in this case is US$2.3b. The last step is to then divide the equity value by the number of shares outstanding. Compared to the current share price of US$99.4, the company appears a touch undervalued at a 26% discount to where the stock price trades currently. Remember though, that this is just an approximate valuation, and like any complex formula - garbage in, garbage out.
Important assumptions
Now the most important inputs to a discounted cash flow are the discount rate, and of course, the actual cash flows. If you don't agree with these result, have a go at the calculation yourself and play with the assumptions. The DCF also does not consider the possible cyclicality of an industry, or a company's future capital requirements, so it does not give a full picture of a company's potential performance. Given that we are looking at American Woodmark as potential shareholders, the cost of equity is used as the discount rate, rather than the cost of capital (or weighted average cost of capital, WACC) which accounts for debt. In this calculation we've used 9.3%, which is based on a levered beta of 1.379. Beta is a measure of a stock's volatility, compared to the market as a whole. We get our beta from the industry average beta of globally comparable companies, with an imposed limit between 0.8 and 2.0, which is a reasonable range for a stable business.
Looking Ahead:
Valuation is only one side of the coin in terms of building your investment thesis, and it is only one of many factors that you need to assess for a company. DCF models are not the be-all and end-all of investment valuation. Rather it should be seen as a guide to "what assumptions need to be true for this stock to be under/overvalued?" For example, changes in the company's cost of equity or the risk free rate can significantly impact the valuation. Why is the intrinsic value higher than the current share price? For American Woodmark, there are three further factors you should assess:
- Risks: Case in point, we've spotted 2 warning signs for American Woodmark you should be aware of.
- Management:Have insiders been ramping up their shares to take advantage of the market's sentiment for AMWD's future outlook? Check out our management and board analysis with insights on CEO compensation and governance factors.
- Other High Quality Alternatives: Do you like a good all-rounder? Explore our interactive list of high quality stocks to get an idea of what else is out there you may be missing!
PS. The Simply Wall St app conducts a discounted cash flow valuation for every stock on the NASDAQGS every day. If you want to find the calculation for other stocks just search here.
If you’re looking to trade American Woodmark, open an account with the lowest-cost* platform trusted by professionals, Interactive Brokers. Their clients from over 200 countries and territories trade stocks, options, futures, forex, bonds and funds worldwide from a single integrated account. Promoted
Valuation is complex, but we're helping make it simple.
Find out whether American Woodmark is potentially over or undervalued by checking out our comprehensive analysis, which includes fair value estimates, risks and warnings, dividends, insider transactions and financial health.
View the Free AnalysisThis article by Simply Wall St is general in nature. It does not constitute a recommendation to buy or sell any stock, and does not take account of your objectives, or your financial situation. We aim to bring you long-term focused analysis driven by fundamental data. Note that our analysis may not factor in the latest price-sensitive company announcements or qualitative material. Simply Wall St has no position in any stocks mentioned.
*Interactive Brokers Rated Lowest Cost Broker by StockBrokers.com Annual Online Review 2020
Have feedback on this article? Concerned about the content? Get in touch with us directly. Alternatively, email editorial-team (at) simplywallst.com.
About NasdaqGS:AMWD
American Woodmark
Manufactures and distributes kitchen, bath, and home organization products for the remodeling and new home construction markets in the United States.
Solid track record with excellent balance sheet.
