Advertisement
- United States
- /
- Banks
- /
- NasdaqGS:SYBT
A Fresh Look at Stock Yards Bancorp (SYBT) Valuation Following Interest Rate Cut Optimism

Simply Wall St
Reviewed by Simply Wall St
Shares of Stock Yards Bancorp (SYBT) moved higher as investors took notice of comments from the New York Fed President, who hinted at more possible interest rate cuts. This could make borrowing cheaper for banks and their customers.
See our latest analysis for Stock Yards Bancorp.
Stock Yards Bancorp’s 3.1% share price gain today comes after a tough stretch for the stock, with momentum still searching for a foothold. This follows a freshly declared dividend and a recent investor conference appearance. Over the past year, the stock’s total shareholder return is down 13.5%. However, patient investors are still sitting on a strong 74% total return over five years. This highlights longer-term resilience even as shorter-term sentiment remains mixed.
If you’re weighing your next move in the market, now’s a great chance to broaden your scope and discover fast growing stocks with high insider ownership
But with shares still down on the year, investors may question whether Stock Yards Bancorp’s current valuation leaves room for upside if conditions improve, or if the full potential for future growth has already been factored in.
Price-to-Earnings of 14.1x: Is it justified?
Stock Yards Bancorp trades at a price-to-earnings ratio of 14.1x, signaling a mixed valuation picture. With a last closing price of $64.72, the market is assigning a higher value to each dollar of earnings compared with some peers. This raises questions about whether this premium is warranted.
The price-to-earnings (P/E) ratio shows how much investors are willing to pay today for a dollar of current earnings. For banks, P/E is a central valuation tool because it reflects market confidence in current profitability and future prospects relative to other banks.
While Stock Yards Bancorp’s P/E is lower than its direct peer group average of 19.3x, it is above both the broader US banks industry average of 11.2x and its own estimated fair price-to-earnings ratio of 10.3x. This suggests that the market could be overestimating future earnings strength or rewarding the firm’s recent growth and earnings quality. The fair ratio, however, indicates there may be room for the P/E to contract if expectations become more moderate.
Explore the SWS fair ratio for Stock Yards Bancorp
Result: Price-to-Earnings of 14.1x (ABOUT RIGHT)
However, slowing revenue and net income growth, combined with persistent underperformance compared to peers, could challenge the stock’s ability to regain lasting upward momentum.
Find out about the key risks to this Stock Yards Bancorp narrative.
Another View: What Does the SWS DCF Model Say?
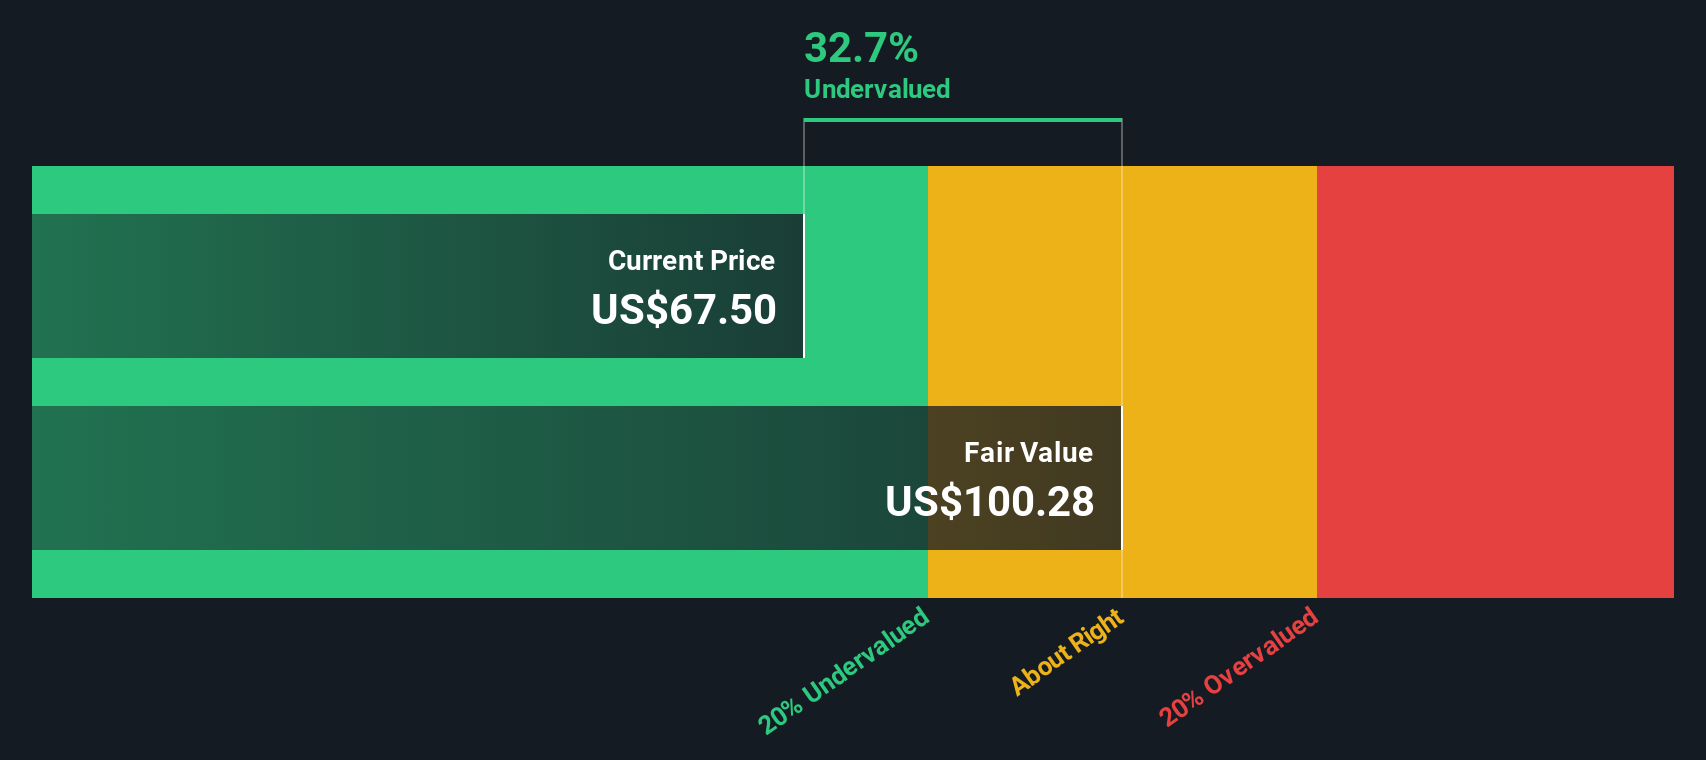
Looking beyond earnings multiples, our DCF model presents a much more optimistic perspective for Stock Yards Bancorp. It suggests the current share price is approximately 37% below its estimated fair value. This could mean the market is significantly undervaluing the bank’s future cash flows. Does this indicate untapped potential, or might it highlight risks the market perceives that the model does not account for?
Look into how the SWS DCF model arrives at its fair value.
Simply Wall St performs a discounted cash flow (DCF) on every stock in the world every day (check out Stock Yards Bancorp for example). We show the entire calculation in full. You can track the result in your watchlist or portfolio and be alerted when this changes, or use our stock screener to discover 926 undervalued stocks based on their cash flows. If you save a screener we even alert you when new companies match - so you never miss a potential opportunity.
Build Your Own Stock Yards Bancorp Narrative
If these conclusions do not quite fit your view or you want to take a hands-on approach, you can explore the numbers to build your perspective in just a few minutes. Do it your way.
A great starting point for your Stock Yards Bancorp research is our analysis highlighting 4 key rewards and 1 important warning sign that could impact your investment decision.
Looking for More Investment Ideas?
Your next great investment may be just a click away. Don’t let the market’s best opportunities pass you by when powerful investing tools are at your fingertips.
- Unlock big income potential and track strong yields by checking out these 16 dividend stocks with yields > 3%, which stand above the rest in today's market.
- Ride the AI wave and tap into future tech growth by researching these 26 AI penny stocks, making real progress in artificial intelligence.
- Capitalize on hidden value with these 926 undervalued stocks based on cash flows, which the market may be overlooking, and position yourself ahead of the crowd.
This article by Simply Wall St is general in nature. We provide commentary based on historical data and analyst forecasts only using an unbiased methodology and our articles are not intended to be financial advice. It does not constitute a recommendation to buy or sell any stock, and does not take account of your objectives, or your financial situation. We aim to bring you long-term focused analysis driven by fundamental data. Note that our analysis may not factor in the latest price-sensitive company announcements or qualitative material. Simply Wall St has no position in any stocks mentioned.
New: Manage All Your Stock Portfolios in One Place
We've created the ultimate portfolio companion for stock investors, and it's free.
• Connect an unlimited number of Portfolios and see your total in one currency
• Be alerted to new Warning Signs or Risks via email or mobile
• Track the Fair Value of your stocks
Have feedback on this article? Concerned about the content? Get in touch with us directly. Alternatively, email editorial-team@simplywallst.com
About NasdaqGS:SYBT
Stock Yards Bancorp
Operates as a holding company for Stock Yards Bank & Trust Company that provides various financial services for individuals, corporations, and others in the United States.
Flawless balance sheet with solid track record and pays a dividend.
Similar Companies
Market Insights

Advertisement
Community Narratives
MicroVision will explode future revenue by 380.37% with a vision towards success
Fair Value US$60.00|98.4% undervalued
TH
Community Contributor
The Indispensable Artery for a New North American Economy
Fair Value CA$132.87|1.3% undervalued
TI
Community Contributor