
Advertisement
Key Insights
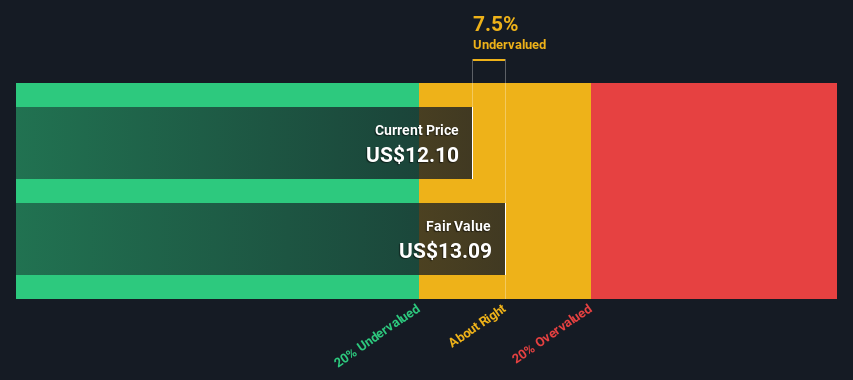
- Using the 2 Stage Free Cash Flow to Equity, Dana fair value estimate is US$13.09
- With US$12.10 share price, Dana appears to be trading close to its estimated fair value
- The US$13.86 analyst price target for DAN is 5.9% more than our estimate of fair value
Today we will run through one way of estimating the intrinsic value of Dana Incorporated (NYSE:DAN) by taking the forecast future cash flows of the company and discounting them back to today's value. This will be done using the Discounted Cash Flow (DCF) model. There's really not all that much to it, even though it might appear quite complex.
We generally believe that a company's value is the present value of all of the cash it will generate in the future. However, a DCF is just one valuation metric among many, and it is not without flaws. If you still have some burning questions about this type of valuation, take a look at the Simply Wall St analysis model.
Check out our latest analysis for Dana
Crunching The Numbers
We use what is known as a 2-stage model, which simply means we have two different periods of growth rates for the company's cash flows. Generally the first stage is higher growth, and the second stage is a lower growth phase. To begin with, we have to get estimates of the next ten years of cash flows. Where possible we use analyst estimates, but when these aren't available we extrapolate the previous free cash flow (FCF) from the last estimate or reported value. We assume companies with shrinking free cash flow will slow their rate of shrinkage, and that companies with growing free cash flow will see their growth rate slow, over this period. We do this to reflect that growth tends to slow more in the early years than it does in later years.
Generally we assume that a dollar today is more valuable than a dollar in the future, so we discount the value of these future cash flows to their estimated value in today's dollars:
10-year free cash flow (FCF) forecast
| 2025 | 2026 | 2027 | 2028 | 2029 | 2030 | 2031 | 2032 | 2033 | 2034 | |
| Levered FCF ($, Millions) | US$62.6m | US$123.6m | US$177.5m | US$191.5m | US$202.2m | US$211.6m | US$219.9m | US$227.6m | US$234.8m | US$241.6m |
| Growth Rate Estimate Source | Analyst x2 | Analyst x2 | Analyst x1 | Analyst x1 | Est @ 5.59% | Est @ 4.63% | Est @ 3.95% | Est @ 3.48% | Est @ 3.15% | Est @ 2.92% |
| Present Value ($, Millions) Discounted @ 12% | US$56.1 | US$99.3 | US$128 | US$124 | US$117 | US$110 | US$102 | US$94.7 | US$87.6 | US$80.8 |
("Est" = FCF growth rate estimated by Simply Wall St)
Present Value of 10-year Cash Flow (PVCF) = US$998m
After calculating the present value of future cash flows in the initial 10-year period, we need to calculate the Terminal Value, which accounts for all future cash flows beyond the first stage. For a number of reasons a very conservative growth rate is used that cannot exceed that of a country's GDP growth. In this case we have used the 5-year average of the 10-year government bond yield (2.4%) to estimate future growth. In the same way as with the 10-year 'growth' period, we discount future cash flows to today's value, using a cost of equity of 12%.
Terminal Value (TV)= FCF2034 × (1 + g) ÷ (r – g) = US$242m× (1 + 2.4%) ÷ (12%– 2.4%) = US$2.7b
Present Value of Terminal Value (PVTV)= TV / (1 + r)10= US$2.7b÷ ( 1 + 12%)10= US$899m
The total value is the sum of cash flows for the next ten years plus the discounted terminal value, which results in the Total Equity Value, which in this case is US$1.9b. To get the intrinsic value per share, we divide this by the total number of shares outstanding. Compared to the current share price of US$12.1, the company appears about fair value at a 7.5% discount to where the stock price trades currently. Valuations are imprecise instruments though, rather like a telescope - move a few degrees and end up in a different galaxy. Do keep this in mind.
The Assumptions
We would point out that the most important inputs to a discounted cash flow are the discount rate and of course the actual cash flows. You don't have to agree with these inputs, I recommend redoing the calculations yourself and playing with them. The DCF also does not consider the possible cyclicality of an industry, or a company's future capital requirements, so it does not give a full picture of a company's potential performance. Given that we are looking at Dana as potential shareholders, the cost of equity is used as the discount rate, rather than the cost of capital (or weighted average cost of capital, WACC) which accounts for debt. In this calculation we've used 12%, which is based on a levered beta of 2.000. Beta is a measure of a stock's volatility, compared to the market as a whole. We get our beta from the industry average beta of globally comparable companies, with an imposed limit between 0.8 and 2.0, which is a reasonable range for a stable business.
SWOT Analysis for Dana
Strength
- Debt is well covered by cash flow.
Weakness
- Interest payments on debt are not well covered.
- Dividend is low compared to the top 25% of dividend payers in the Auto Components market.
Opportunity
- Annual earnings are forecast to grow faster than the American market.
- Current share price is below our estimate of fair value.
Threat
- Dividends are not covered by earnings.
- Annual revenue is forecast to grow slower than the American market.
Next Steps:
Valuation is only one side of the coin in terms of building your investment thesis, and it shouldn't be the only metric you look at when researching a company. It's not possible to obtain a foolproof valuation with a DCF model. Preferably you'd apply different cases and assumptions and see how they would impact the company's valuation. For instance, if the terminal value growth rate is adjusted slightly, it can dramatically alter the overall result. For Dana, we've put together three relevant factors you should assess:
- Risks: For example, we've discovered 3 warning signs for Dana (1 is significant!) that you should be aware of before investing here.
- Future Earnings: How does DAN's growth rate compare to its peers and the wider market? Dig deeper into the analyst consensus number for the upcoming years by interacting with our free analyst growth expectation chart.
- Other High Quality Alternatives: Do you like a good all-rounder? Explore our interactive list of high quality stocks to get an idea of what else is out there you may be missing!
PS. Simply Wall St updates its DCF calculation for every American stock every day, so if you want to find the intrinsic value of any other stock just search here.
New: Manage All Your Stock Portfolios in One Place
We've created the ultimate portfolio companion for stock investors, and it's free.
• Connect an unlimited number of Portfolios and see your total in one currency
• Be alerted to new Warning Signs or Risks via email or mobile
• Track the Fair Value of your stocks
Have feedback on this article? Concerned about the content? Get in touch with us directly. Alternatively, email editorial-team (at) simplywallst.com.
This article by Simply Wall St is general in nature. We provide commentary based on historical data and analyst forecasts only using an unbiased methodology and our articles are not intended to be financial advice. It does not constitute a recommendation to buy or sell any stock, and does not take account of your objectives, or your financial situation. We aim to bring you long-term focused analysis driven by fundamental data. Note that our analysis may not factor in the latest price-sensitive company announcements or qualitative material. Simply Wall St has no position in any stocks mentioned.
Have feedback on this article? Concerned about the content? Get in touch with us directly. Alternatively, email editorial-team@simplywallst.com
About NYSE:DAN
Dana
Provides power-conveyance and energy-management solutions for vehicles and machinery in North America, Europe, South America, and the Asia Pacific.
Average dividend payer with moderate growth potential.
Similar Companies
Market Insights

Advertisement
Community Narratives
MicroVision will explode future revenue by 380.37% with a vision towards success
Fair Value US$60.00|98.5% undervalued
TH
Community Contributor
The Indispensable Artery for a New North American Economy
Fair Value CA$132.87|2.3% undervalued
TI
Community Contributor