Advertisement
- United States
- /
- Auto Components
- /
- NYSE:APTV
Does Aptiv’s 46% Rally Match Its True Value After Latest Electrification Partnerships?

Simply Wall St
Reviewed by Bailey Pemberton
- Ever wondered if Aptiv is priced right now, or if you're missing out on a unique opportunity in the auto tech world?
- The stock has rebounded impressively this year, up 34.1% year-to-date and an eye-catching 46.4% over the past 12 months, even after some pullback in the last week and month.
- Recent news has focused on Aptiv's strategic partnerships and major advancements in vehicle electrification, suggesting a strong push to cement its role as a leading solutions provider for evolving automotive trends. These developments have added fresh momentum as investors weigh both the upside and the ever-changing risk profile.
- When we break things down by the numbers, Aptiv scores a 4 out of 6 on our valuation check. This is solid, but is that the whole story? Stick around as we dive into the core valuation methods and reveal an even smarter way to judge value by the end of this article.
Approach 1: Aptiv Discounted Cash Flow (DCF) Analysis
The Discounted Cash Flow (DCF) model estimates a company's true value by projecting its expected future cash flows and then discounting those figures back to today's dollars. This approach aims to give investors a clear sense of what the business is worth right now based on its ability to generate cash in the years ahead.
For Aptiv, the DCF model uses a two-stage Free Cash Flow to Equity method. Currently, Aptiv is generating $1.62 billion in free cash flow. Analysts have provided forecasts for the next several years, with cash flow expected to reach as much as $1.97 billion by the end of 2028. Looking even further ahead, Simply Wall St extrapolates these trends to show free cash flows potentially rising to nearly $2.76 billion by 2035, which suggests a steady and healthy growth trajectory.
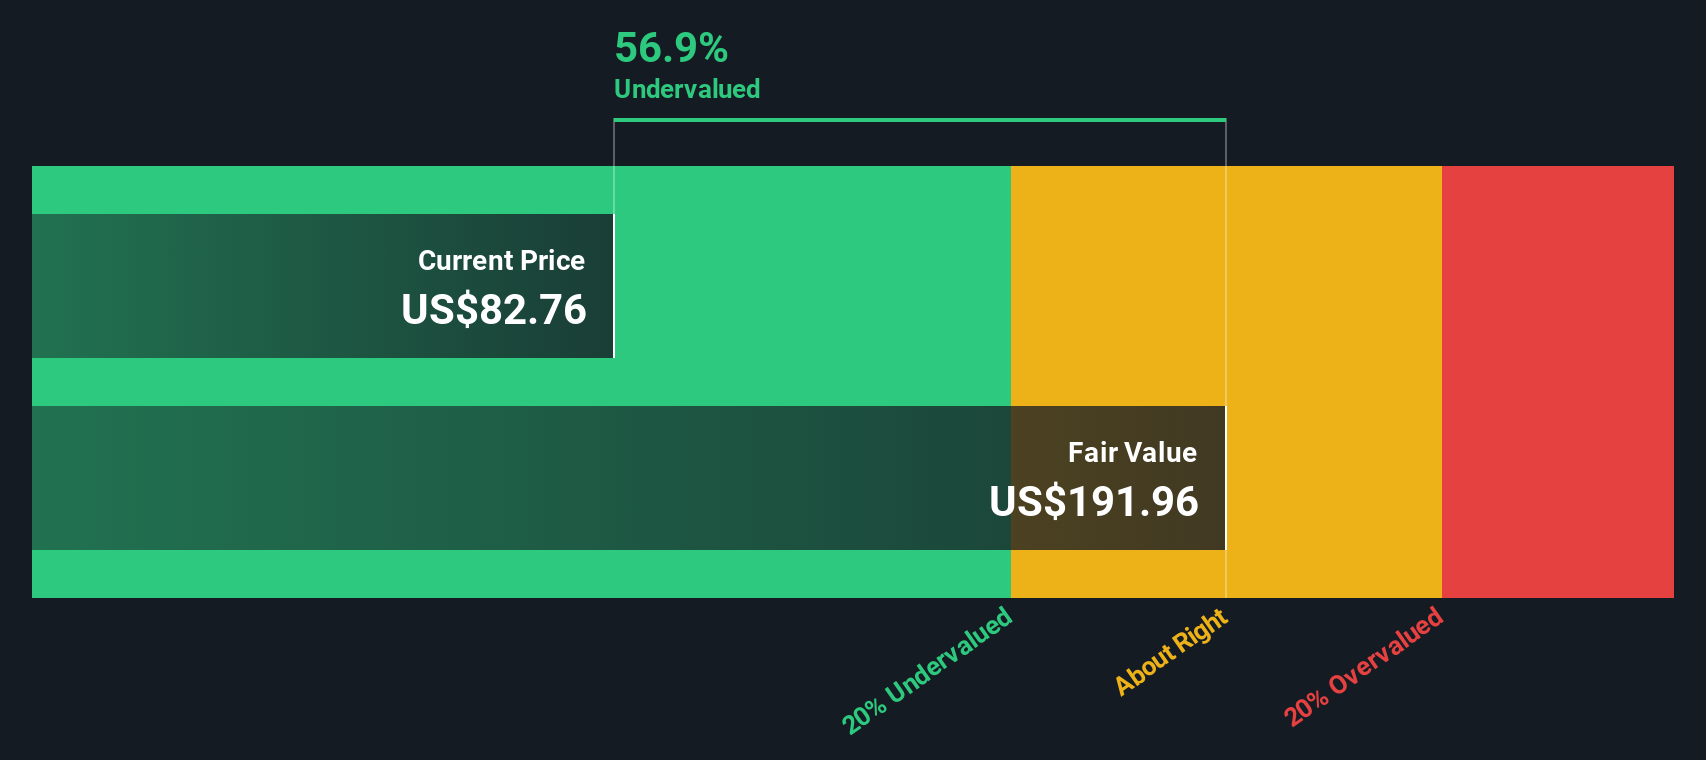
Based on these projections and after discounting future cash flows to their present value, the estimated intrinsic value for Aptiv’s shares comes out to $160.32. This suggests the stock is currently trading with a 49.6% discount to its calculated fair value. In other words, Aptiv appears significantly undervalued according to the DCF analysis.
Result: UNDERVALUED
Our Discounted Cash Flow (DCF) analysis suggests Aptiv is undervalued by 49.6%. Track this in your watchlist or portfolio, or discover 844 more undervalued stocks based on cash flows.
Approach 2: Aptiv Price vs Earnings (P/E)
The Price-to-Earnings (P/E) ratio is a widely used valuation multiple for profitable companies like Aptiv, as it relates a company’s share price to its per-share earnings. It helps investors assess whether a stock is fairly valued relative to its earnings power, and is especially meaningful for companies with positive and stable earnings.
Growth expectations and perceived risk play a big role in determining what qualifies as a "fair" P/E ratio. High-growth companies or those with lower risk are generally awarded higher P/E multiples by the market, while more cyclical or risky businesses often trade at lower multiples, reflecting their uncertainty or earnings volatility.
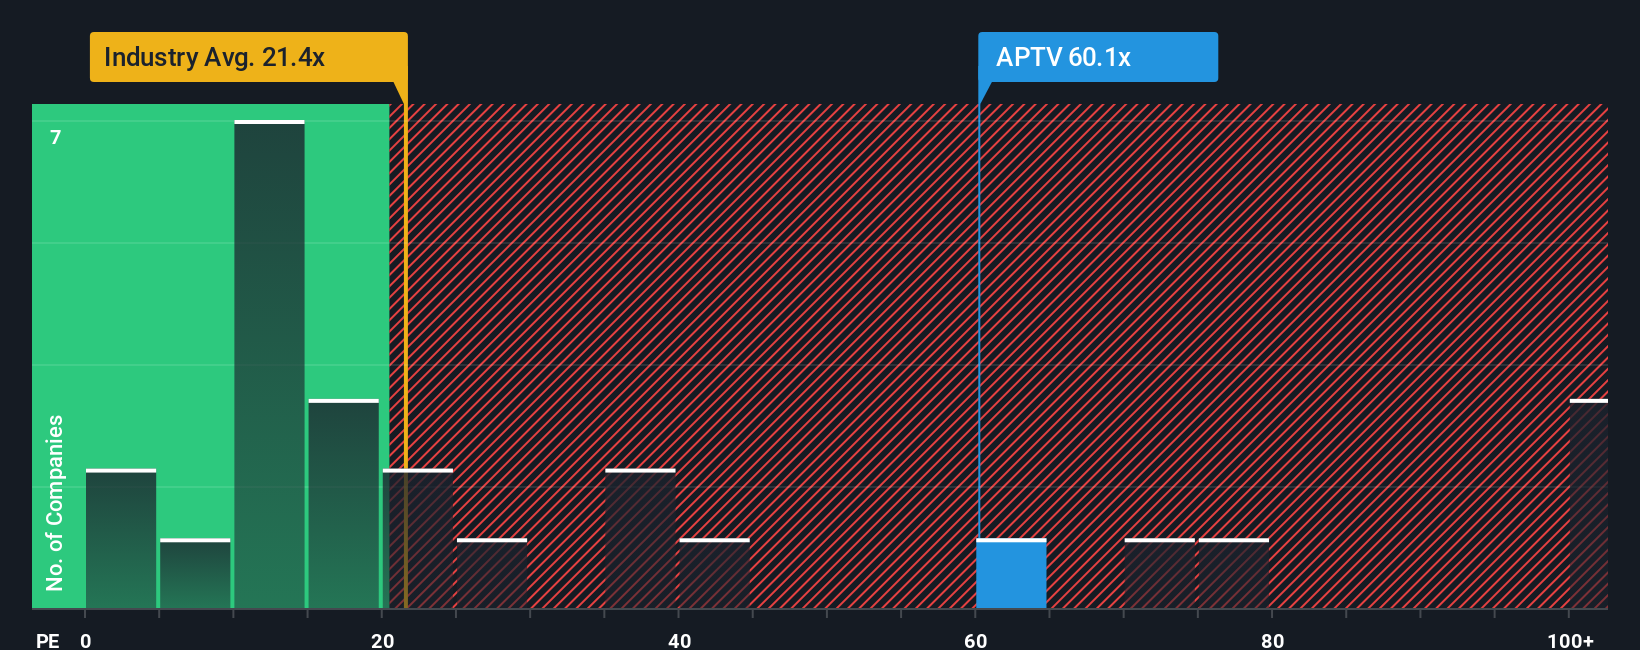
Aptiv’s current P/E ratio stands at 59.2x, which is significantly above both the Auto Components industry average of 19.9x and the peer average of 33.8x. At first glance, this suggests Aptiv is priced richly compared to its sector. However, one-size-fits-all comparisons can miss important subtleties such as the company’s unique growth prospects, margins, risk profile, and size.
That is why Simply Wall St introduces the “Fair Ratio,” a tailored measure that incorporates these factors to estimate what P/E would be justified for Aptiv’s circumstances. For Aptiv, the Fair Ratio is 77.2x. This nuanced approach is more insightful than basic industry or peer comparisons, as it adjusts for aspects like higher expected earnings growth, stronger margins, or lower risk, as well as differences in scale within the sector.
Comparing the Fair Ratio of 77.2x to Aptiv’s current P/E of 59.2x, the shares appear undervalued based on this more holistic benchmark.
Result: UNDERVALUED
PE ratios tell one story, but what if the real opportunity lies elsewhere? Discover 1410 companies where insiders are betting big on explosive growth.
Upgrade Your Decision Making: Choose your Aptiv Narrative
Earlier we mentioned that there is an even better way to understand valuation, so let's introduce you to Narratives. A Narrative is more than just numbers; it's your story and perspective on a company, captured as a set of assumptions about Aptiv's future revenue, earnings, and margins, which together inform what you think the fair value should be.
By connecting the company's business drivers, financial forecasts, and your personal outlook, Narratives turn abstract data into a living investment thesis that updates automatically as new information arrives. On Simply Wall St's Community page, used by millions of investors, you can easily select or compare Narratives for Aptiv, helping you decide whether today's price offers an opportunity.
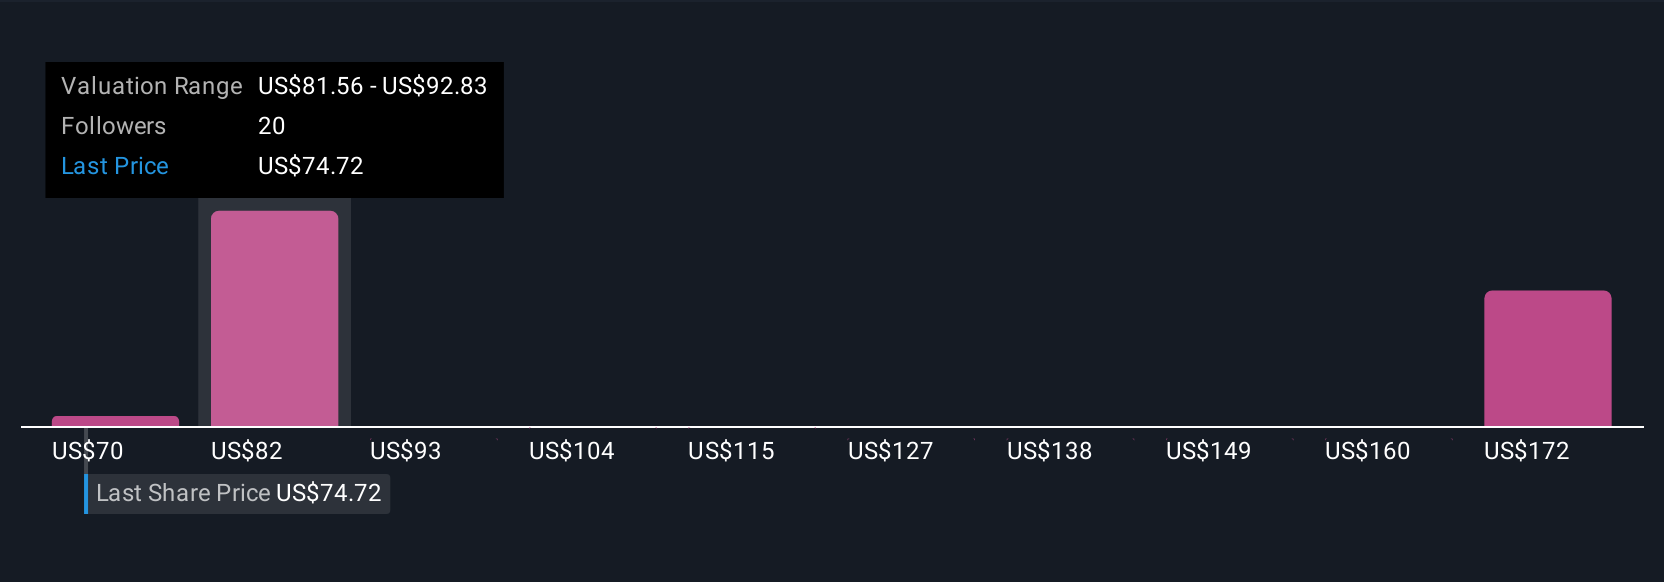
If the current price is well below the Narrative's fair value, it may be time to buy; if it rises well above, it could be time to consider selling. Narratives reflect both consensus and differing investor beliefs. For instance, some see Aptiv heading to $97 per share based on strong technology growth, while the most cautious expect just $60, weighing industry risks and margin uncertainty.
Do you think there's more to the story for Aptiv? Head over to our Community to see what others are saying!
This article by Simply Wall St is general in nature. We provide commentary based on historical data and analyst forecasts only using an unbiased methodology and our articles are not intended to be financial advice. It does not constitute a recommendation to buy or sell any stock, and does not take account of your objectives, or your financial situation. We aim to bring you long-term focused analysis driven by fundamental data. Note that our analysis may not factor in the latest price-sensitive company announcements or qualitative material. Simply Wall St has no position in any stocks mentioned.
New: Manage All Your Stock Portfolios in One Place
We've created the ultimate portfolio companion for stock investors, and it's free.
• Connect an unlimited number of Portfolios and see your total in one currency
• Be alerted to new Warning Signs or Risks via email or mobile
• Track the Fair Value of your stocks
Have feedback on this article? Concerned about the content? Get in touch with us directly. Alternatively, email editorial-team@simplywallst.com
About NYSE:APTV
Aptiv
Engages in design, manufacture, and sale of vehicle components for the automotive and commercial vehicle markets in North America, Europe, the Middle East, Africa, the Asia Pacific, South America, and internationally.
Good value with moderate growth potential.
Similar Companies
Market Insights

Advertisement
Community Narratives
The company that turned a verb into a global necessity and basically runs the modern internet, digital ads, smartphones, maps, and AI.
Fair Value US$300.00|7.5% undervalued
OS
Community Contributor
Flowers Foods Pays A Fair Price For Health
Fair Value US$16.12|25.4% undervalued
NV
Community Contributor
TMX Group will thrive with 33.3% profit margin and enduring market moat
Fair Value CA$49.90|3.6% overvalued
LI
Community Contributor
The "Molecular Pencil": Why Beam's Technology is Built to Win
Fair Value US$65.01|65.0% undervalued
DA
Community Contributor