- United States
- /
- Auto Components
- /
- NasdaqGS:KNDI
Kandi Technologies Group, Inc. (NASDAQ:KNDI) May Have Run Too Fast Too Soon With Recent 27% Price Plummet
The Kandi Technologies Group, Inc. (NASDAQ:KNDI) share price has fared very poorly over the last month, falling by a substantial 27%. The recent drop completes a disastrous twelve months for shareholders, who are sitting on a 56% loss during that time.
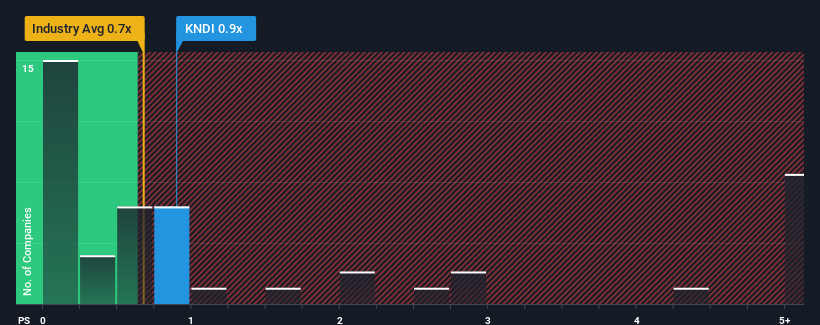
In spite of the heavy fall in price, it's still not a stretch to say that Kandi Technologies Group's price-to-sales (or "P/S") ratio of 0.9x right now seems quite "middle-of-the-road" compared to the Auto Components industry in the United States, where the median P/S ratio is around 0.7x. However, investors might be overlooking a clear opportunity or potential setback if there is no rational basis for the P/S.
See our latest analysis for Kandi Technologies Group

What Does Kandi Technologies Group's P/S Mean For Shareholders?
For instance, Kandi Technologies Group's receding revenue in recent times would have to be some food for thought. One possibility is that the P/S is moderate because investors think the company might still do enough to be in line with the broader industry in the near future. If not, then existing shareholders may be a little nervous about the viability of the share price.
Want the full picture on earnings, revenue and cash flow for the company? Then our free report on Kandi Technologies Group will help you shine a light on its historical performance.What Are Revenue Growth Metrics Telling Us About The P/S?
Kandi Technologies Group's P/S ratio would be typical for a company that's only expected to deliver moderate growth, and importantly, perform in line with the industry.
In reviewing the last year of financials, we were disheartened to see the company's revenues fell to the tune of 4.8%. Regardless, revenue has managed to lift by a handy 29% in aggregate from three years ago, thanks to the earlier period of growth. Although it's been a bumpy ride, it's still fair to say the revenue growth recently has been mostly respectable for the company.
Comparing the recent medium-term revenue trends against the industry's one-year growth forecast of 24% shows it's noticeably less attractive.
In light of this, it's curious that Kandi Technologies Group's P/S sits in line with the majority of other companies. Apparently many investors in the company are less bearish than recent times would indicate and aren't willing to let go of their stock right now. Maintaining these prices will be difficult to achieve as a continuation of recent revenue trends is likely to weigh down the shares eventually.
The Bottom Line On Kandi Technologies Group's P/S
Kandi Technologies Group's plummeting stock price has brought its P/S back to a similar region as the rest of the industry. Generally, our preference is to limit the use of the price-to-sales ratio to establishing what the market thinks about the overall health of a company.
We've established that Kandi Technologies Group's average P/S is a bit surprising since its recent three-year growth is lower than the wider industry forecast. When we see weak revenue with slower than industry growth, we suspect the share price is at risk of declining, bringing the P/S back in line with expectations. If recent medium-term revenue trends continue, the probability of a share price decline will become quite substantial, placing shareholders at risk.
You should always think about risks. Case in point, we've spotted 1 warning sign for Kandi Technologies Group you should be aware of.
If companies with solid past earnings growth is up your alley, you may wish to see this free collection of other companies with strong earnings growth and low P/E ratios.
Valuation is complex, but we're here to simplify it.
Discover if Kandi Technologies Group might be undervalued or overvalued with our detailed analysis, featuring fair value estimates, potential risks, dividends, insider trades, and its financial condition.
Access Free AnalysisHave feedback on this article? Concerned about the content? Get in touch with us directly. Alternatively, email editorial-team (at) simplywallst.com.
This article by Simply Wall St is general in nature. We provide commentary based on historical data and analyst forecasts only using an unbiased methodology and our articles are not intended to be financial advice. It does not constitute a recommendation to buy or sell any stock, and does not take account of your objectives, or your financial situation. We aim to bring you long-term focused analysis driven by fundamental data. Note that our analysis may not factor in the latest price-sensitive company announcements or qualitative material. Simply Wall St has no position in any stocks mentioned.
About NasdaqGS:KNDI
Kandi Technologies Group
Produces and sells electric off-road vehicles and associated parts in the People’s Republic of China, the United States, and internationally.
Adequate balance sheet with very low risk.
Market Insights
Community Narratives


