
Advertisement
- Taiwan
- /
- Electronic Equipment and Components
- /
- TWSE:6658
SynPower Co., Ltd.'s (TWSE:6658) Stock is Soaring But Financials Seem Inconsistent: Will The Uptrend Continue?
SynPower (TWSE:6658) has had a great run on the share market with its stock up by a significant 16% over the last month. But the company's key financial indicators appear to be differing across the board and that makes us question whether or not the company's current share price momentum can be maintained. Specifically, we decided to study SynPower's ROE in this article.
Return on equity or ROE is a key measure used to assess how efficiently a company's management is utilizing the company's capital. In simpler terms, it measures the profitability of a company in relation to shareholder's equity.
View our latest analysis for SynPower
How To Calculate Return On Equity?
Return on equity can be calculated by using the formula:
Return on Equity = Net Profit (from continuing operations) ÷ Shareholders' Equity
So, based on the above formula, the ROE for SynPower is:
3.2% = NT$36m ÷ NT$1.1b (Based on the trailing twelve months to March 2024).
The 'return' is the profit over the last twelve months. One way to conceptualize this is that for each NT$1 of shareholders' capital it has, the company made NT$0.03 in profit.
What Has ROE Got To Do With Earnings Growth?
So far, we've learned that ROE is a measure of a company's profitability. Depending on how much of these profits the company reinvests or "retains", and how effectively it does so, we are then able to assess a company’s earnings growth potential. Generally speaking, other things being equal, firms with a high return on equity and profit retention, have a higher growth rate than firms that don’t share these attributes.
A Side By Side comparison of SynPower's Earnings Growth And 3.2% ROE
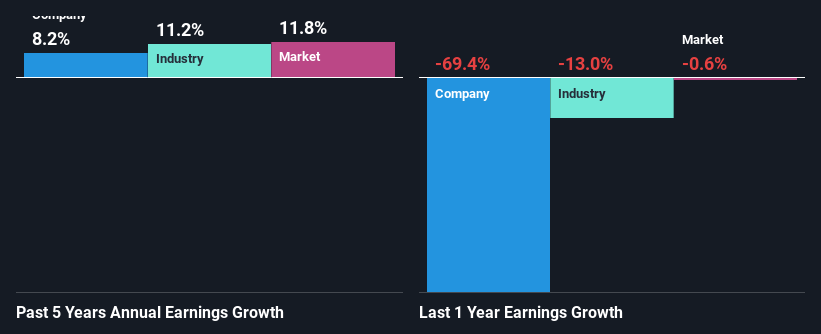
At first glance, SynPower's ROE doesn't look very promising. We then compared the company's ROE to the broader industry and were disappointed to see that the ROE is lower than the industry average of 8.6%. Although, we can see that SynPower saw a modest net income growth of 8.2% over the past five years. So, the growth in the company's earnings could probably have been caused by other variables. For instance, the company has a low payout ratio or is being managed efficiently.
As a next step, we compared SynPower's net income growth with the industry and were disappointed to see that the company's growth is lower than the industry average growth of 11% in the same period.
The basis for attaching value to a company is, to a great extent, tied to its earnings growth. What investors need to determine next is if the expected earnings growth, or the lack of it, is already built into the share price. Doing so will help them establish if the stock's future looks promising or ominous. If you're wondering about SynPower's's valuation, check out this gauge of its price-to-earnings ratio, as compared to its industry.
Is SynPower Using Its Retained Earnings Effectively?
SynPower has a significant three-year median payout ratio of 62%, meaning that it is left with only 38% to reinvest into its business. This implies that the company has been able to achieve decent earnings growth despite returning most of its profits to shareholders.
While SynPower has been growing its earnings, it only recently started to pay dividends which likely means that the company decided to impress new and existing shareholders with a dividend.
Summary
Overall, we have mixed feelings about SynPower. Although the company has shown a fair bit of growth in earnings, the reinvestment rate is low. Meaning, the earnings growth number could have been significantly higher had the company been retaining more of its profits and reinvesting that at a higher rate of return. Up till now, we've only made a short study of the company's growth data. To gain further insights into SynPower's past profit growth, check out this visualization of past earnings, revenue and cash flows.
New: Manage All Your Stock Portfolios in One Place
We've created the ultimate portfolio companion for stock investors, and it's free.
• Connect an unlimited number of Portfolios and see your total in one currency
• Be alerted to new Warning Signs or Risks via email or mobile
• Track the Fair Value of your stocks
Have feedback on this article? Concerned about the content? Get in touch with us directly. Alternatively, email editorial-team (at) simplywallst.com.
This article by Simply Wall St is general in nature. We provide commentary based on historical data and analyst forecasts only using an unbiased methodology and our articles are not intended to be financial advice. It does not constitute a recommendation to buy or sell any stock, and does not take account of your objectives, or your financial situation. We aim to bring you long-term focused analysis driven by fundamental data. Note that our analysis may not factor in the latest price-sensitive company announcements or qualitative material. Simply Wall St has no position in any stocks mentioned.
About TWSE:6658
SynPower
Engages in the manufacture, testing, and sale of electronic equipment and the surface processing of printed circuit board (PCB) in Taiwan, Asia, and Internationally.
Proven track record with adequate balance sheet.
Market Insights

Advertisement
Community Narratives
MicroVision will explode future revenue by 380.37% with a vision towards success
Fair Value US$60.00|98.4% undervalued
TH
Community Contributor
The Indispensable Artery for a New North American Economy
Fair Value CA$132.87|1.3% undervalued
TI
Community Contributor