Stock Analysis
- Taiwan
- /
- Electronic Equipment and Components
- /
- TWSE:5469
HannStar Board (TWSE:5469) sheds 6.8% this week, as yearly returns fall more in line with earnings growth


When you buy and hold a stock for the long term, you definitely want it to provide a positive return. But more than that, you probably want to see it rise more than the market average. But HannStar Board Corporation (TWSE:5469) has fallen short of that second goal, with a share price rise of 78% over five years, which is below the market return. Some buyers are laughing, though, with an increase of 25% in the last year.
Since the long term performance has been good but there's been a recent pullback of 6.8%, let's check if the fundamentals match the share price.
View our latest analysis for HannStar Board
While the efficient markets hypothesis continues to be taught by some, it has been proven that markets are over-reactive dynamic systems, and investors are not always rational. One flawed but reasonable way to assess how sentiment around a company has changed is to compare the earnings per share (EPS) with the share price.
During five years of share price growth, HannStar Board achieved compound earnings per share (EPS) growth of 4.7% per year. This EPS growth is lower than the 12% average annual increase in the share price. So it's fair to assume the market has a higher opinion of the business than it did five years ago. And that's hardly shocking given the track record of growth.
The graphic below depicts how EPS has changed over time (unveil the exact values by clicking on the image).
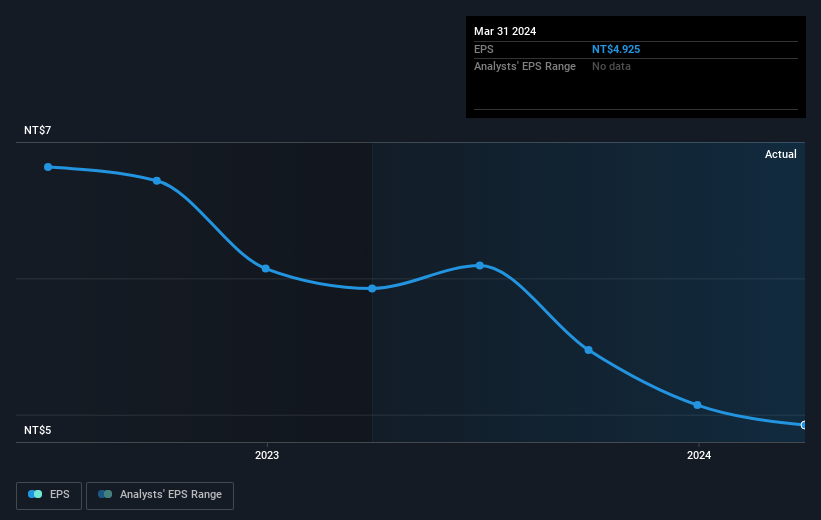
This free interactive report on HannStar Board's earnings, revenue and cash flow is a great place to start, if you want to investigate the stock further.
What About Dividends?
When looking at investment returns, it is important to consider the difference between total shareholder return (TSR) and share price return. The TSR is a return calculation that accounts for the value of cash dividends (assuming that any dividend received was reinvested) and the calculated value of any discounted capital raisings and spin-offs. Arguably, the TSR gives a more comprehensive picture of the return generated by a stock. We note that for HannStar Board the TSR over the last 5 years was 126%, which is better than the share price return mentioned above. The dividends paid by the company have thusly boosted the total shareholder return.
A Different Perspective
HannStar Board's TSR for the year was broadly in line with the market average, at 32%. Most would be happy with a gain, and it helps that the year's return is actually better than the average return over five years, which was 18%. It is possible that management foresight will bring growth well into the future, even if the share price slows down. While it is well worth considering the different impacts that market conditions can have on the share price, there are other factors that are even more important. For instance, we've identified 1 warning sign for HannStar Board that you should be aware of.
If you would prefer to check out another company -- one with potentially superior financials -- then do not miss this free list of companies that have proven they can grow earnings.
Please note, the market returns quoted in this article reflect the market weighted average returns of stocks that currently trade on Taiwanese exchanges.
Valuation is complex, but we're helping make it simple.
Find out whether HannStar Board is potentially over or undervalued by checking out our comprehensive analysis, which includes fair value estimates, risks and warnings, dividends, insider transactions and financial health.
View the Free AnalysisHave feedback on this article? Concerned about the content? Get in touch with us directly. Alternatively, email editorial-team (at) simplywallst.com.
This article by Simply Wall St is general in nature. We provide commentary based on historical data and analyst forecasts only using an unbiased methodology and our articles are not intended to be financial advice. It does not constitute a recommendation to buy or sell any stock, and does not take account of your objectives, or your financial situation. We aim to bring you long-term focused analysis driven by fundamental data. Note that our analysis may not factor in the latest price-sensitive company announcements or qualitative material. Simply Wall St has no position in any stocks mentioned.
About TWSE:5469
HannStar Board
Manufactures, assembles, and sells printed circuit boards (PCBs) in Taiwan.
Flawless balance sheet, good value and pays a dividend.
